2026.4·It's all relative
All releases · April 3, 2026 · Jan Hellemans
This is the release where Clarida extends the qPCR workflow to analyses. You could already define, design, and execute your experiment. Now you can analyze it too. Import your Cq data, flag problematic measurements, calculate amplification efficiency from standard curves, and walk all the way to normalized relative quantities without ever leaving the platform.
What I started 20 years ago with a simple Excel template for qPCR data analysis has now arrived in a much more capable package. Still built on the qBase quantification framework published in Genome Biology back in 2007, but now enhanced with upfront design functionality and an intuitive interface.
Happy analysis.
Jan
New features
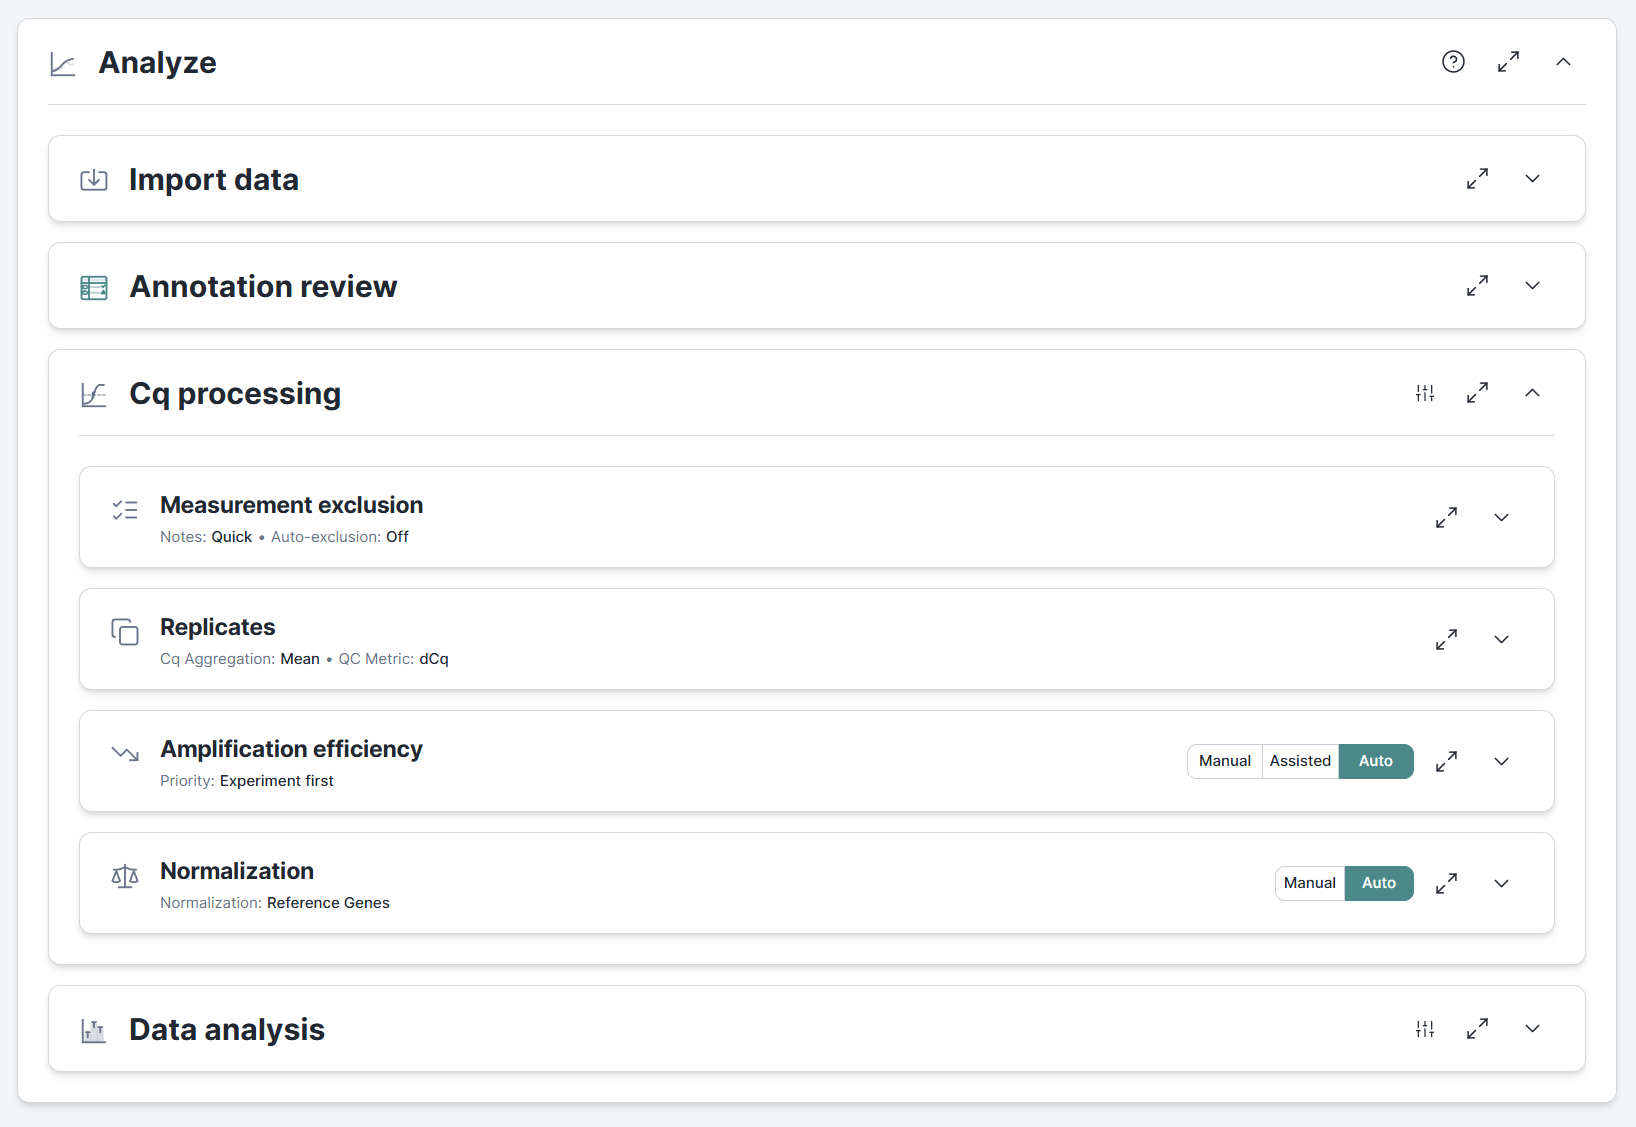
Full qPCR analysis pipeline
Before this release, Clarida stopped at execution. With 2026.4, a new Analyze section guides you from import to inspection of analysis results. Smart defaults and auto-processing make for swift and intuitive analyses while manual mode and custom settings allow researchers to take full control.
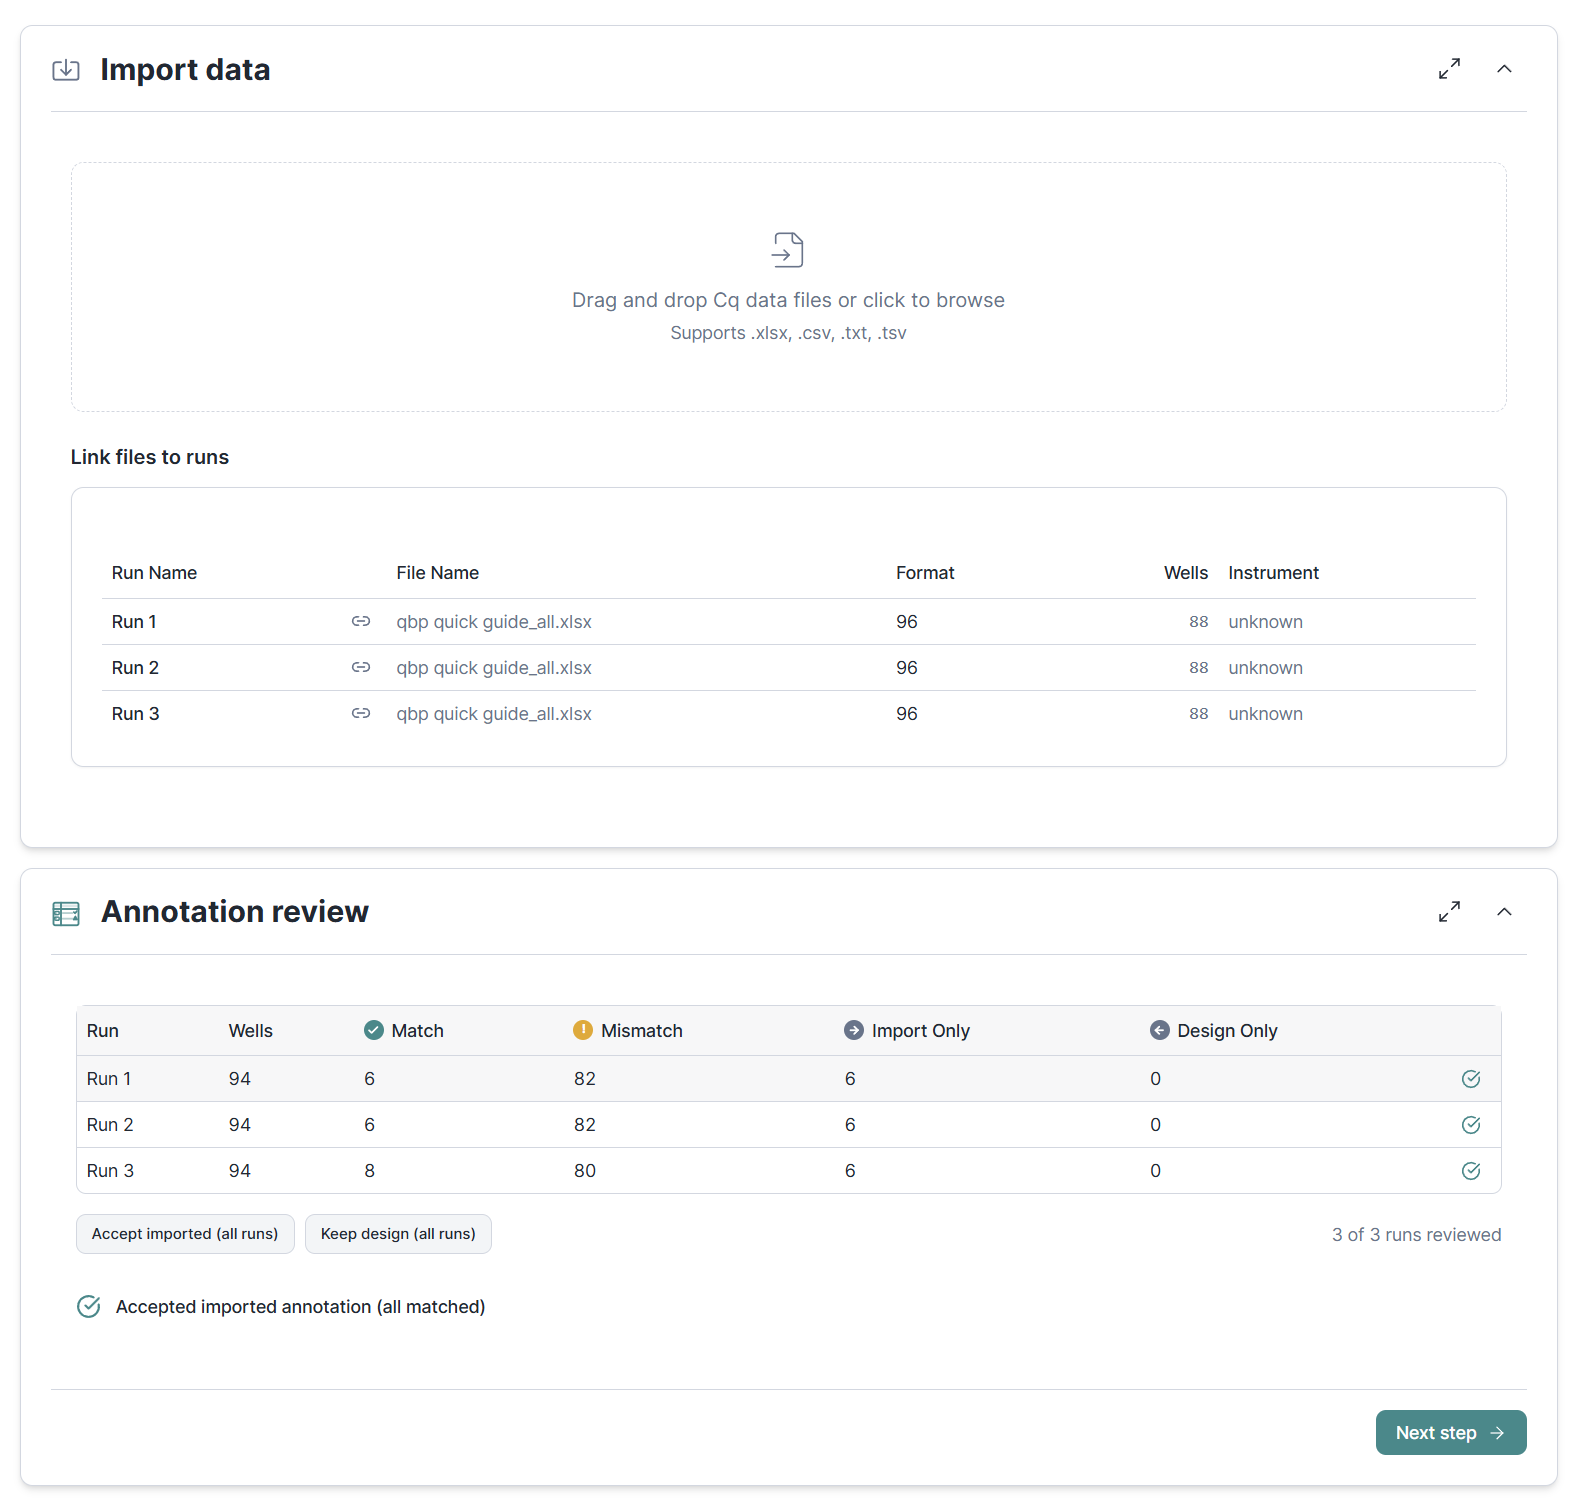
Import Cq values from CSV, TXT, or Excel files. Save time by importing multiple files or a single file with several data sheets in one go. An annotation review catches mismatches between the imported data and your experiment design before you proceed.
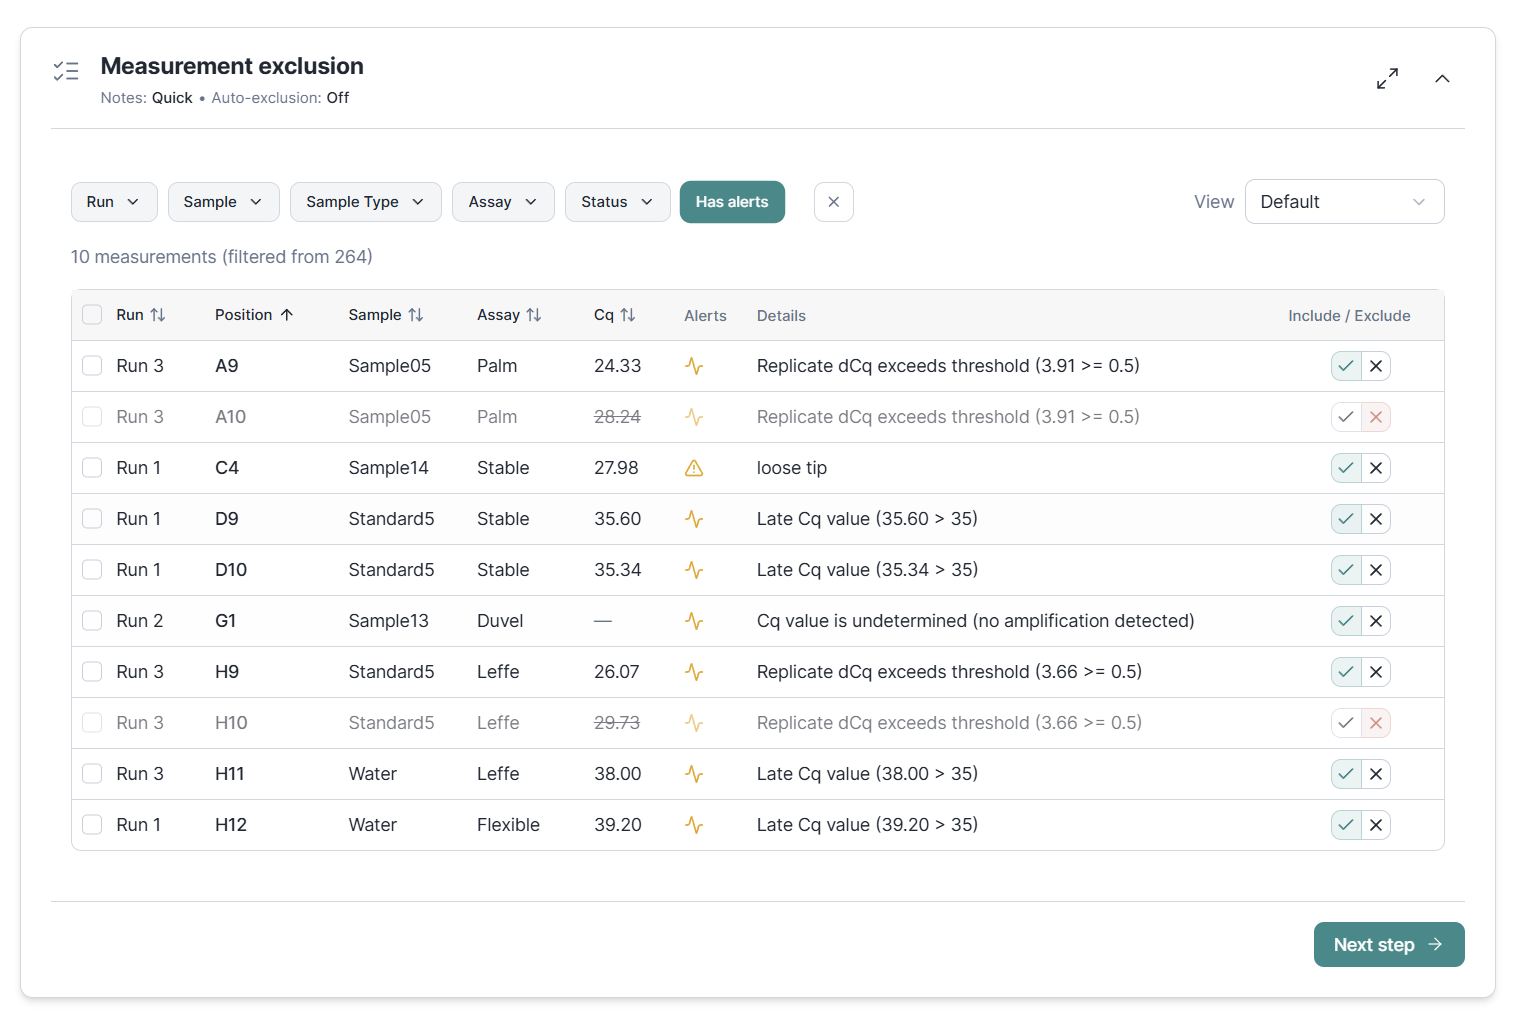
Measurement-level quality control lets you flag and exclude outliers. Flags from the execution stage and Cq value screening are shown to quickly focus on the measurements that require your attention. Beyond full manual control, auto-exclusion of outliers or bad replicates is there to quickly proceed with good data only.
Next up are a global review of replicate quality and an inspection of dilution curves for determination of amplification efficiency. The last step of data processing is the inspection of data normalization. We support multi-gene normalization and provide a geNorm based quality control on the stability of your reference genes to allow spotting and exclusion of bad normalizers.
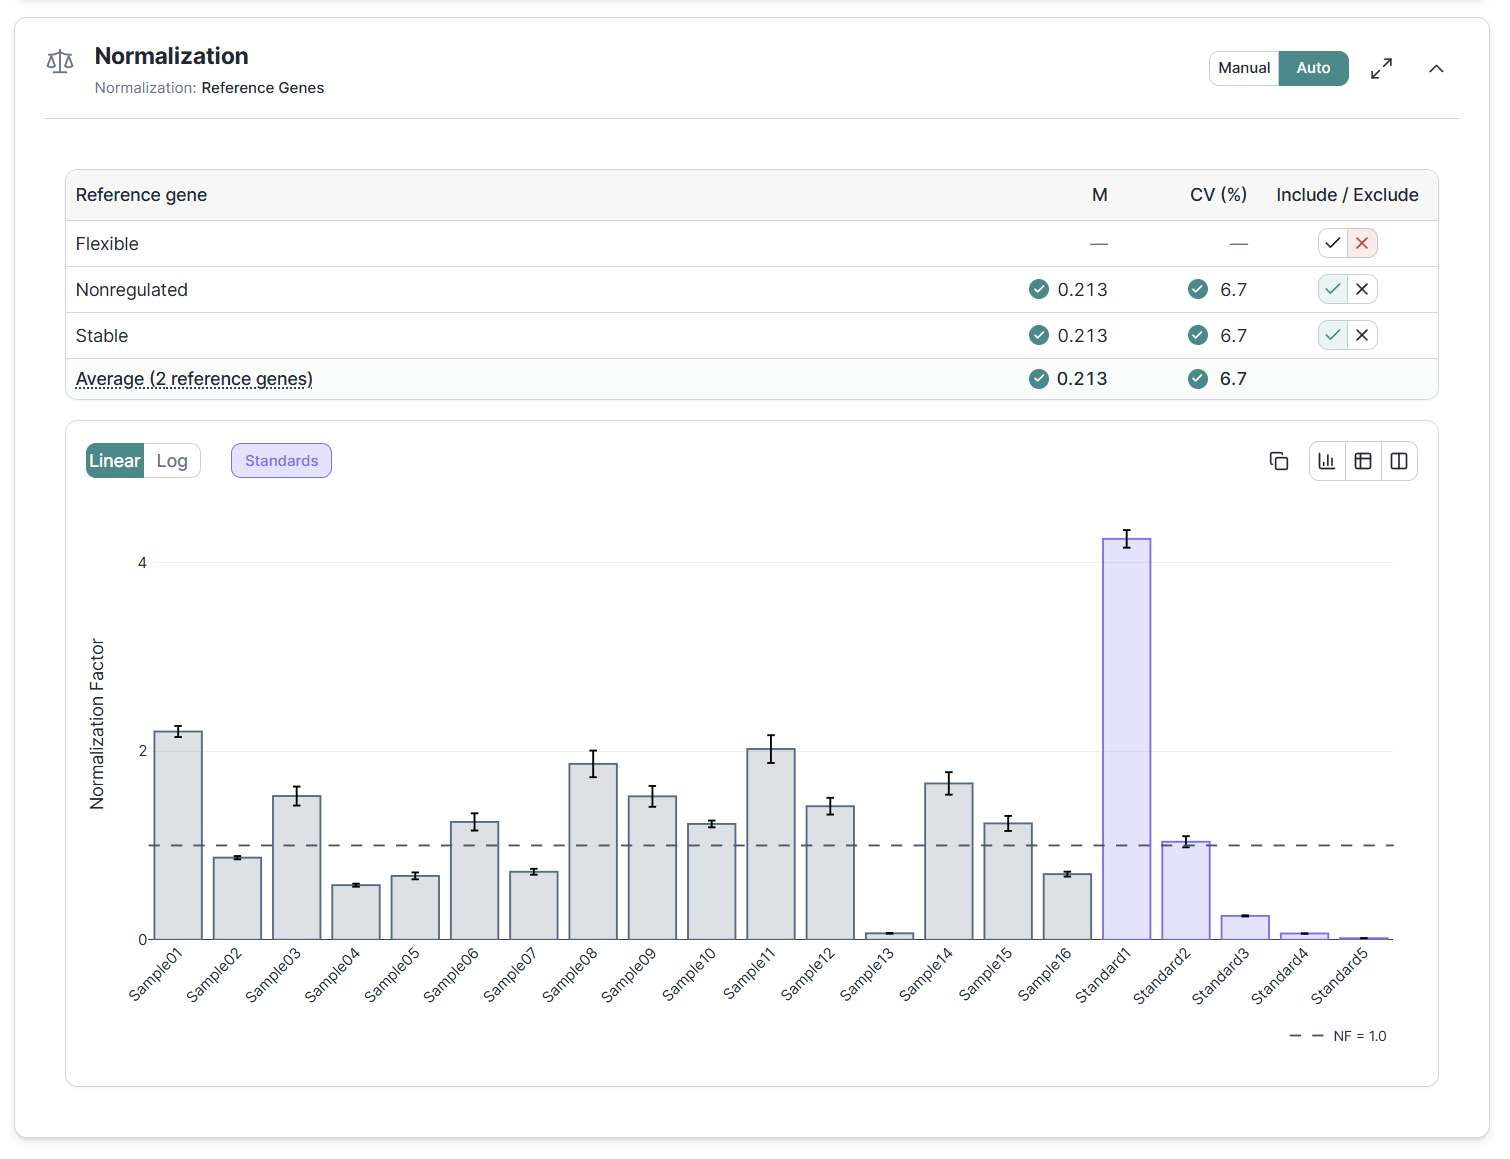
The pipeline culminates in efficiency-corrected, reference-gene-normalized relative quantities (NRQ) following the qBase framework. Change an upstream setting, an exclusion, an efficiency value or a reference gene selection and everything downstream recalculates within seconds. All results persist across sessions.
Multi-run experiments
Our March release brought auto-design to speed up your preparations for small experiments. In April we are adding multi-run support. By default we avoid spreading mixes across multiple-runs but, as always, you can change this and tweak the layout however you want.
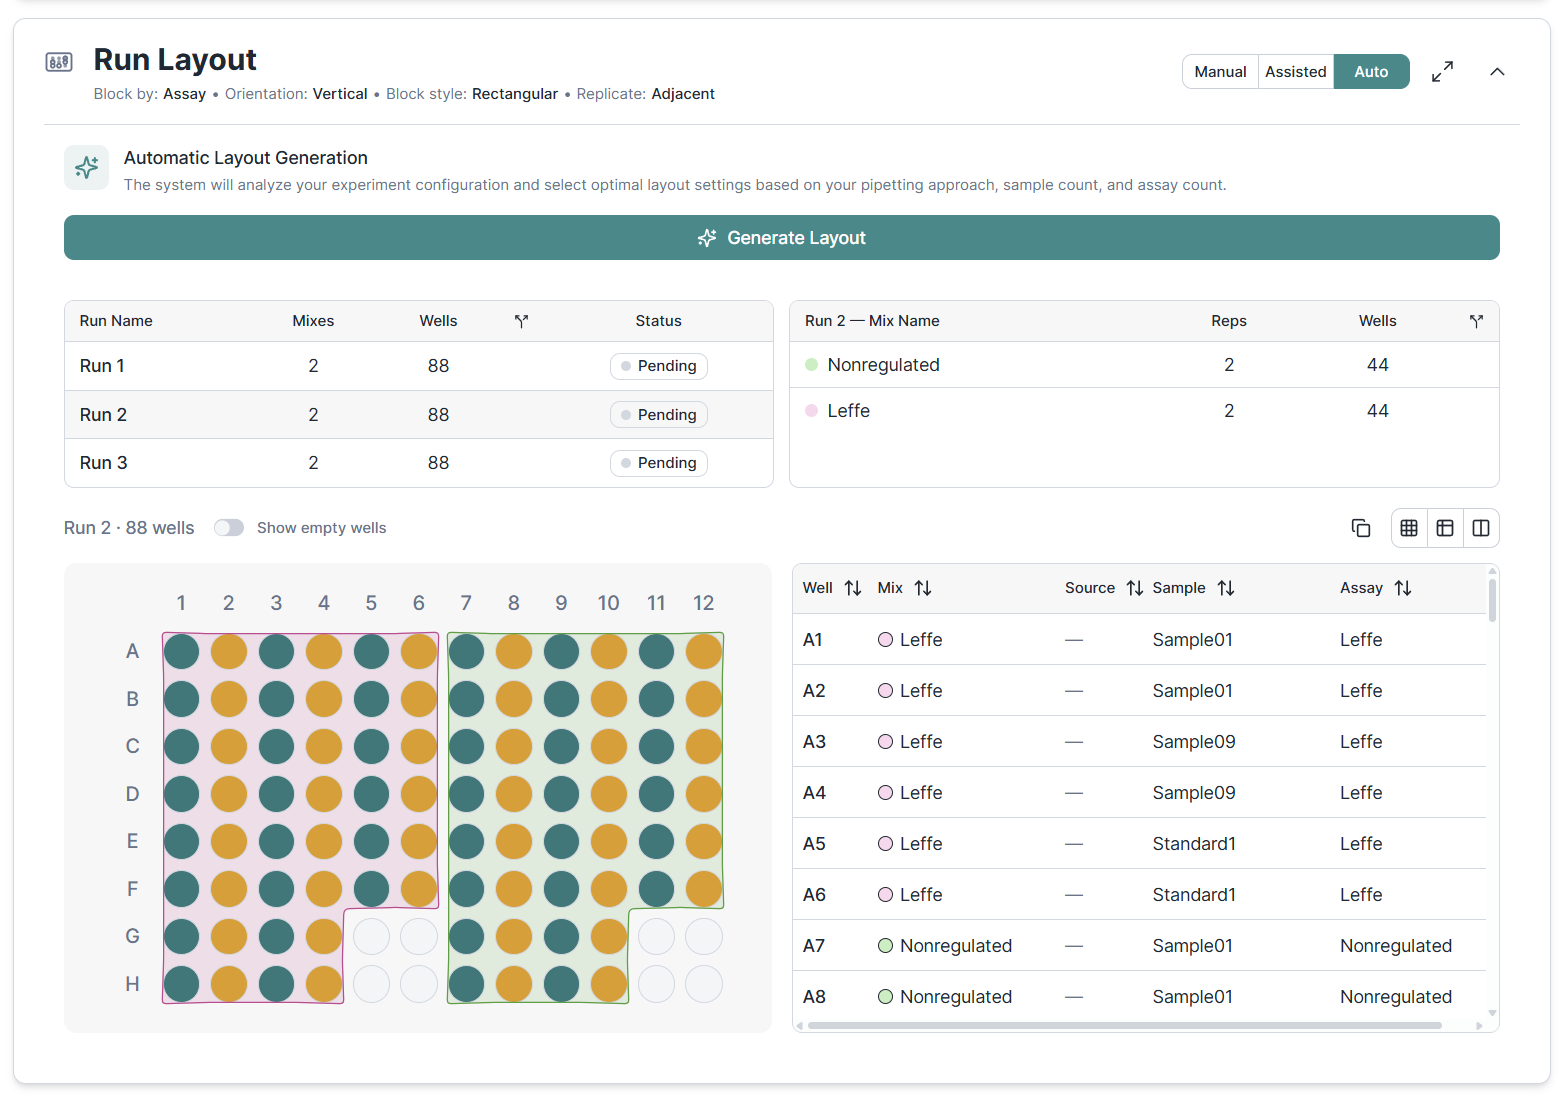
Bringing larger experiments to the lab is yet another challenge. Clarida provides you with a list of materials needed and instructions for preparing mixes and filling plates. Some experiments can be handled in one go, others may require multiple sessions. We've got you covered with multi-session execution. Select the runs you want to prepare. We tell you about the material needed for this session only and recalculate mixes to only cover what is needed for the selected plates.
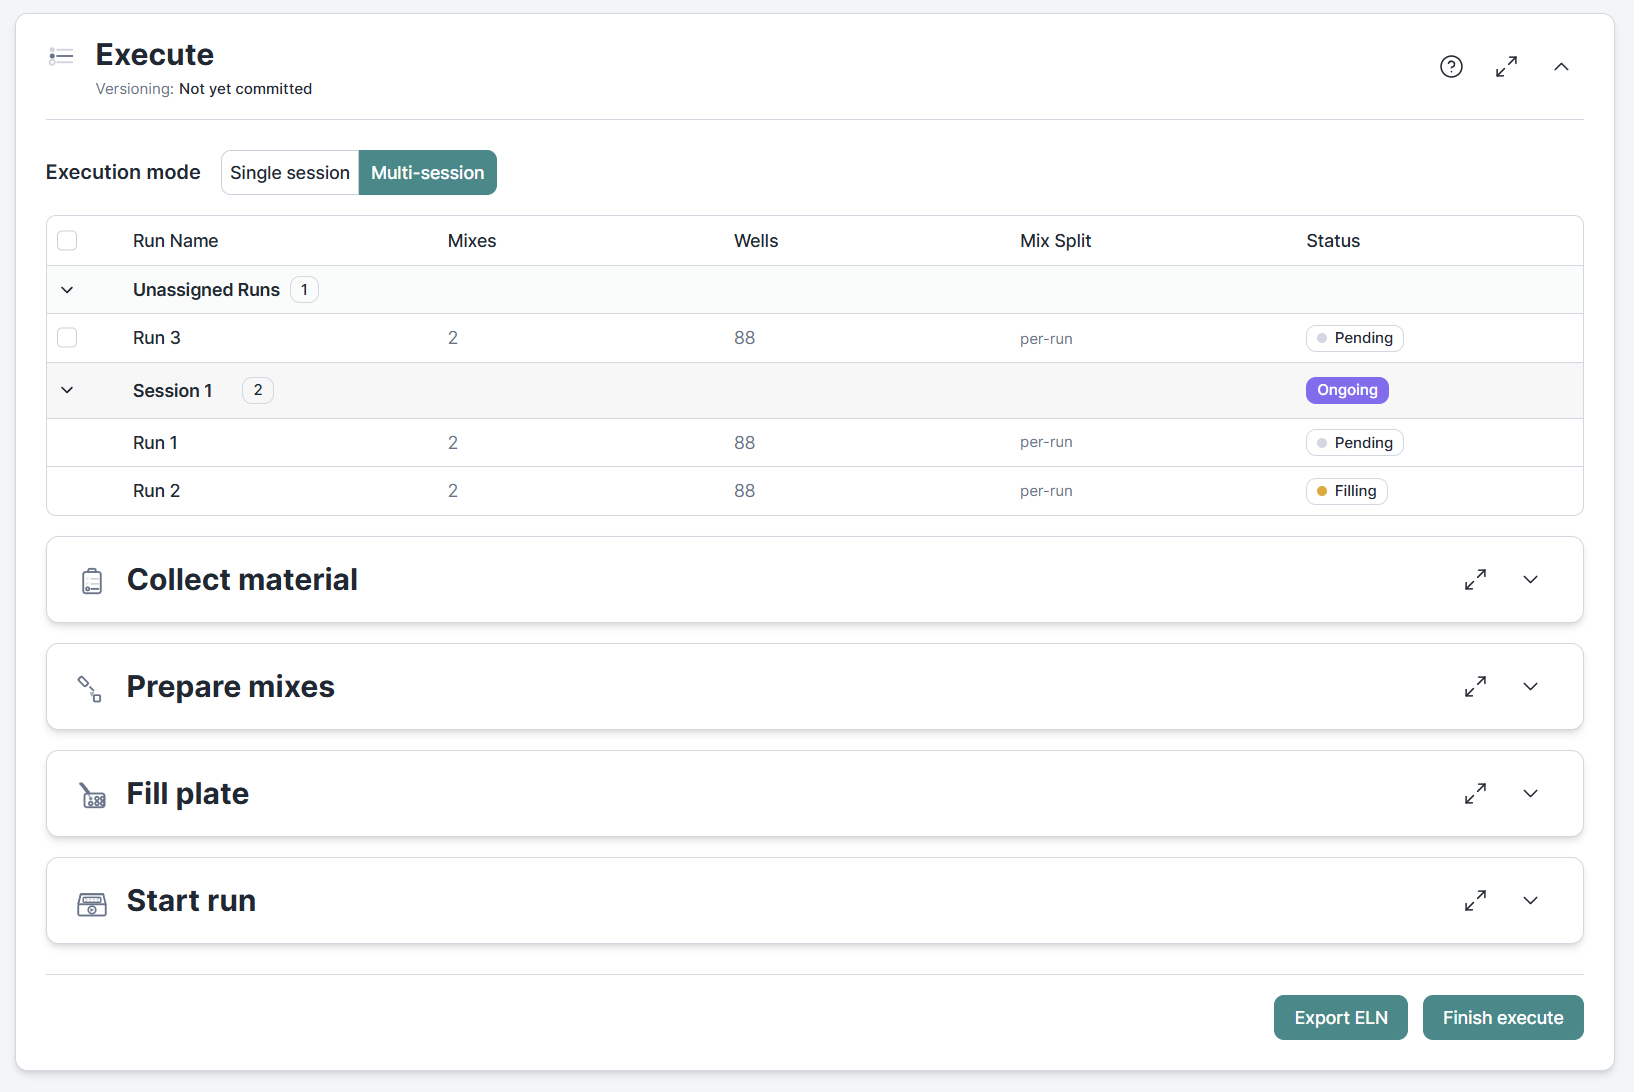
Run progress, mix state, and completion status all persist and sync automatically. Ideal to keep track of your more challenging experiments.
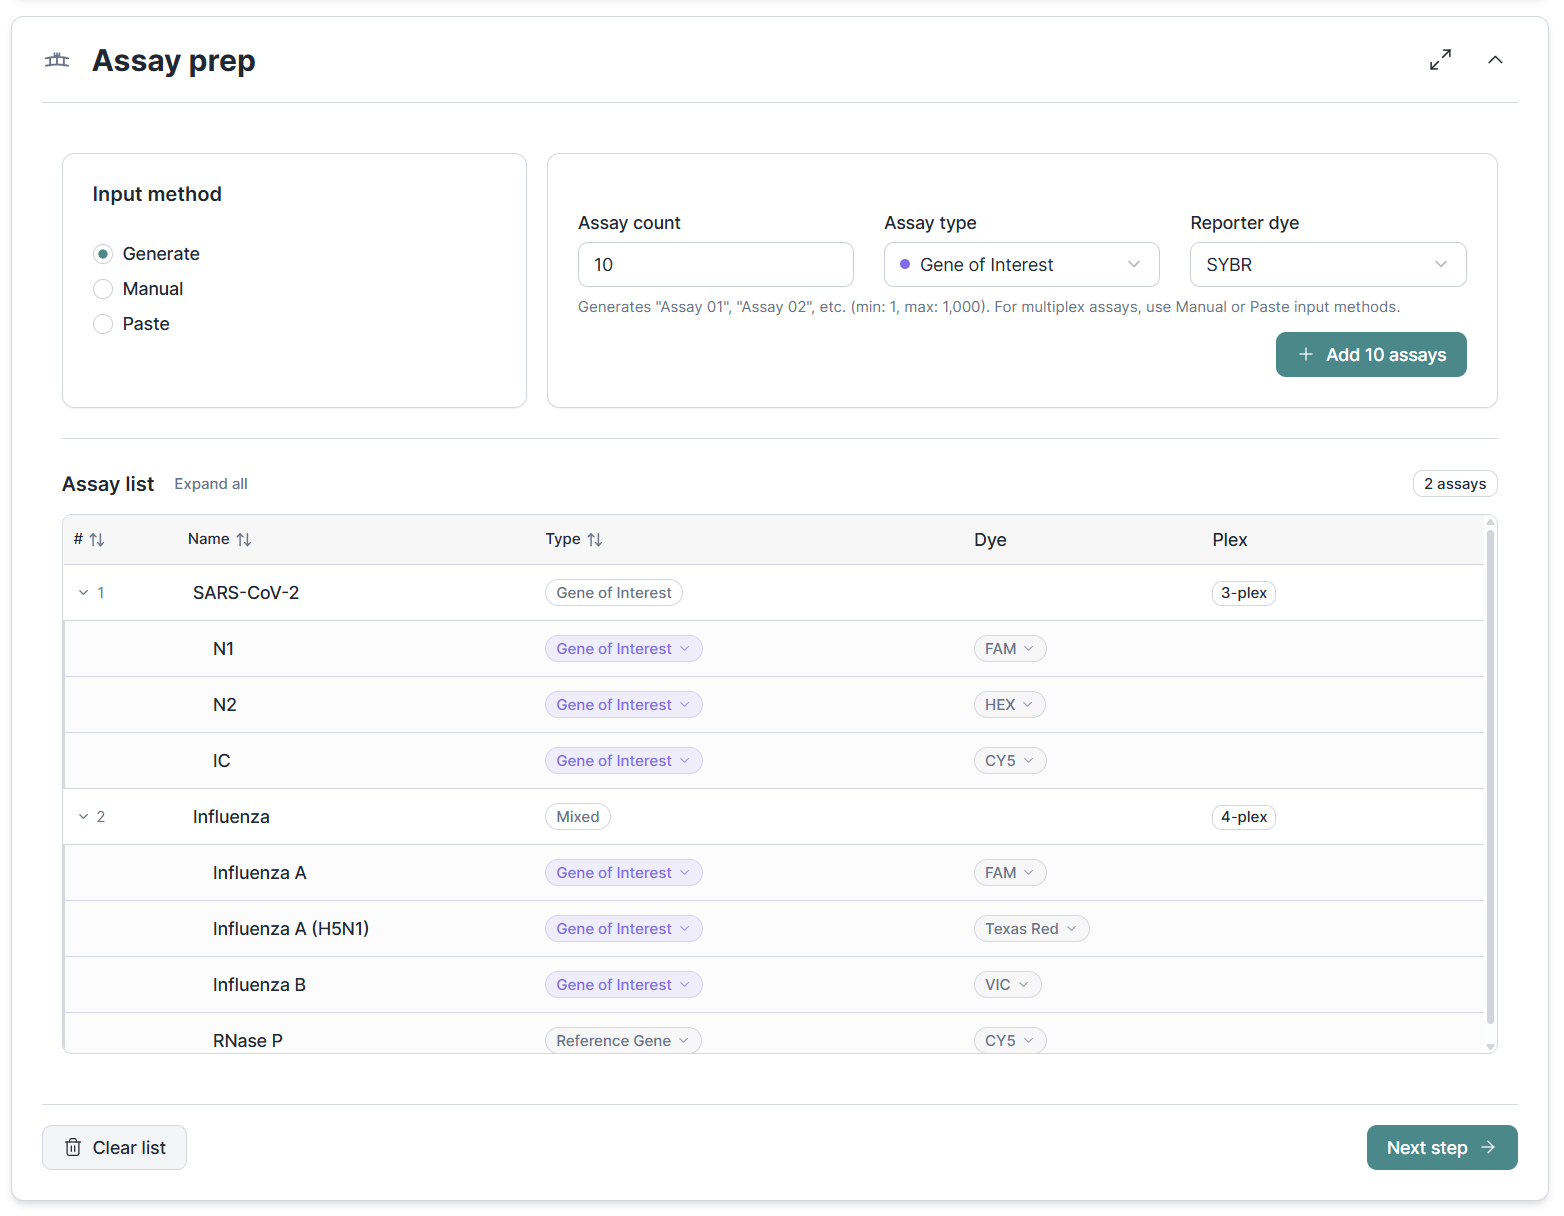
Multiplex assay support
You can now define multiplex assays directly in Assay Prep, with part-level editing for individual targets within a multiplex group. Downstream sections like efficiency calculation, normalization and quantification all respect the multiplex structure but simplify to just the assay level (hiding part details) for singleplex assays.
Quality of life
- Experiment versioning · We create experiment snapshots whenever you finish a workflow stage or import run data so you can always restore to such a save point.
- Display names · We now differentiate between the original sample or assay name and the display name you may want to use as a shorthand or alias within the context of a given experiment. Exports and UI consistently use these display names while preserving traceability to the original library or import names.
- Reworked ELN export · The Excel export now produces one Execute sheet per session, with session-filtered sample lists, assay lists, per-run pipetting tables, and 96-well plate grid visualizations. If your experiment has multiple runs, each run gets its own clearly labeled sections.