2026.6·Trust your numbers
All releases · June 9, 2026 · Jan Hellemans
In April we introduced the qPCR analysis pipeline for relative quantification. The qbase+ migration added in May left some gaps for features supported in qbase+ but lacking in Clarida. That gap is now fully fixed. With 2026.6 we added all analyses and quality controls provided by qbase+ and evolved from getting a number to trusting it. You can now scan your samples and assays for outliers and failed controls at a glance, calibrate quantities across plates so multi-run experiments are actually comparable, normalize large panels without picking reference genes, run the confirmatory statistical tests your paper needs, and save any exploration as an annotated, citable and frozen record.
This is also the release where Clarida grows up commercially: the first paid plans are live, so your lab can move past the free tier on its own, no email thread required.
Go explore. Do analyze.
Jan
New features
Comparable quantities across plates
In experiments with individual assays spread across plates, technical artifacts could introduce run-specific biases that affect reliable comparison of samples between runs. Clarida now removes that offset automatically with inter-run calibration: for a given assay, any biological sample you happen to place on more than one plate becomes an inter-run calibrator used to correct for any run-specific bias detected.
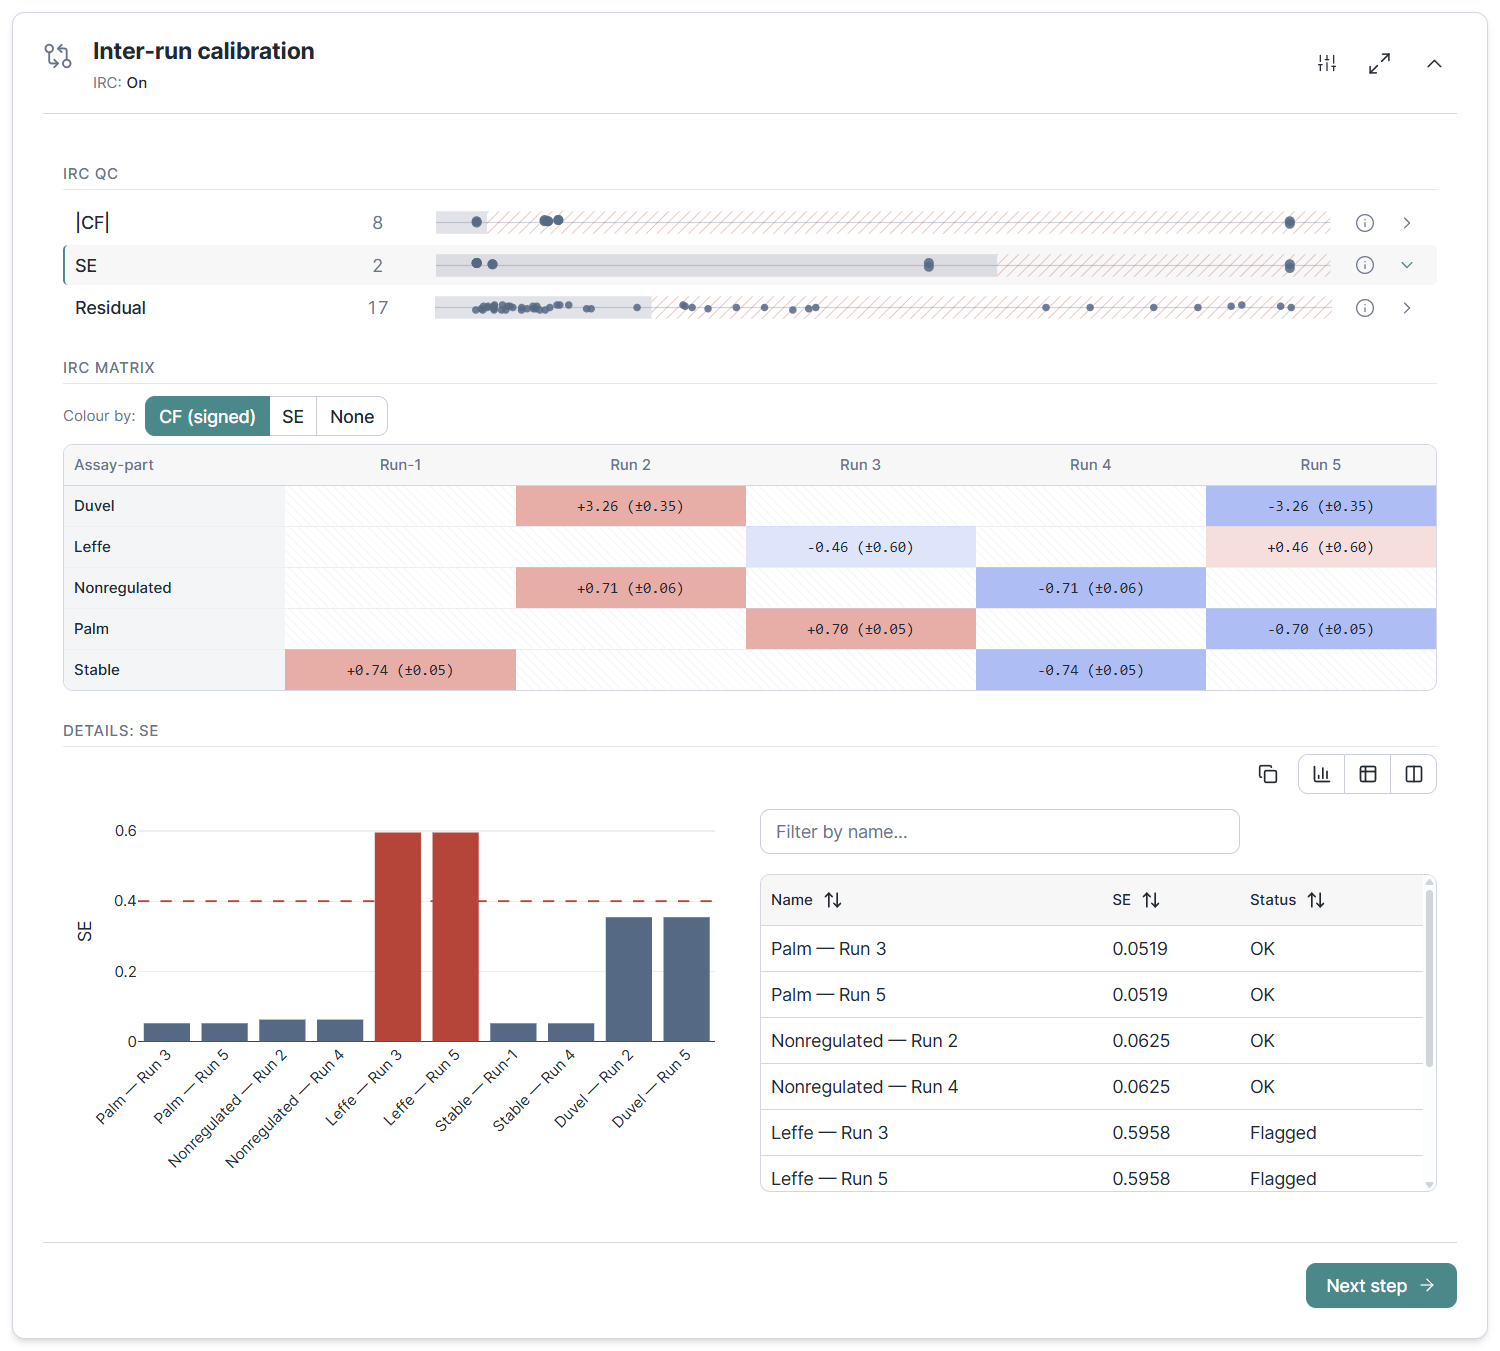
The calibration algorithm uses an ordinary least squares fit to convert Cq values into calibrated Cq values in a way that is independent of the experiment design or the order in which runs are combined. Any run that cannot be calibrated for lack of inter-run calibrators is given a calibration factor of zero, assuming no run-specific bias and applying no correction at all. An assay-run matrix shows you the calibration factor applied and its standard error, turning calibration into a quality check: a large factor or error points straight at a problem run, and disconnected runs are surfaced explicitly rather than silently producing wrong numbers.
Note to former qbase+ users: in Clarida there is no need to manually define inter-run calibrators or to differentially name samples re-occurring in different runs. Just use a single, unique name for any biological sample across your entire experiment. If individual assays are spread across runs, any sample measured for that assay in multiple runs will automatically be used for inter-run calibration. Another major benefit is that Clarida's inter-run calibration algorithm is much more lenient on experiment design, accepting virtually any setup you may throw at it.
Global mean normalization for large panels
For whole-miRNome and other large unbiased panels, picking a fixed set of reference genes is often unreliable or simply impractical. Clarida now offers Global Mean normalization as a third method alongside None and Reference Genes, normalizing to the geometric mean of all detected targets following the D'haene et al. 2012 framework.

The same table that evaluates your normalization doubles as a follow-up planning tool: it surfaces the most stable targets so you can pick a small panel of surrogate reference genes to validate in a smaller downstream study. A "common" variant restricts the calculation to targets detected in every sample, so variable dropouts don't bias the result.
Sample and assay QC at a glance
A new QC section sits between Cq processing and Exploration and gives you a fast, scannable read on data quality. Outlier samples and assays stand out on normalization factor, average Cq, detection fraction, and replicate count. Positive and negative controls are checked against their expected ranges in the same view.

All quality metrics are neatly summarized as a list of horizontal dot-plot strips with OK and issue zones, so you can easily spot distribution outliers and control failures. This brings qbase+ Sample QC parity to Clarida and extends it with a symmetric Assay QC that qbase+ never had, making failed targets and contamination as easy to catch as problem samples. Click on any of the dot plots for a bar chart view with details at the sample or assay level.
Save and revisit your explorations
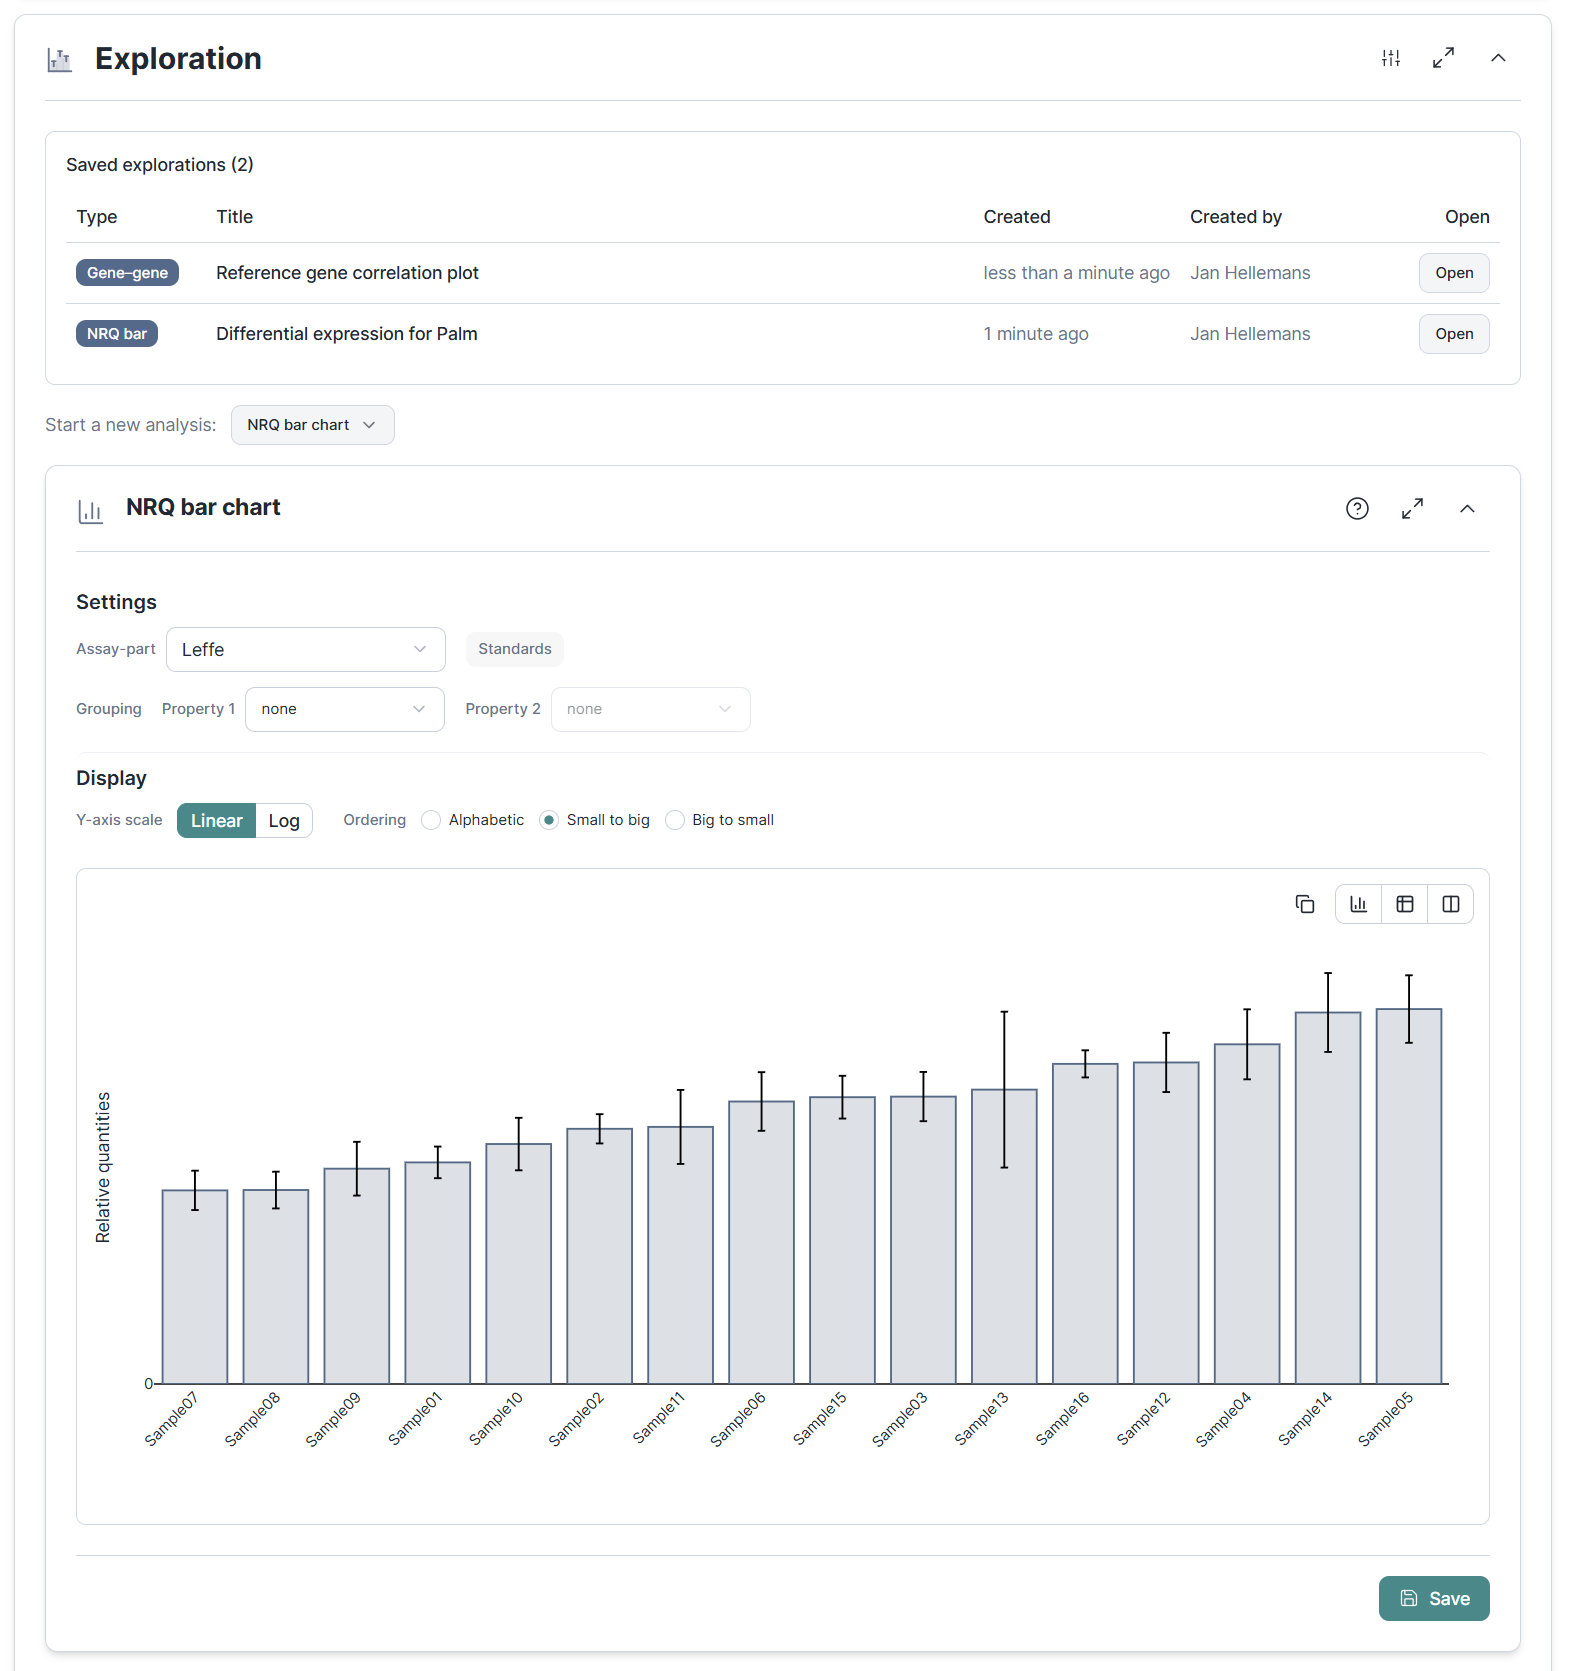
For the sake of scientific rigor, and to minimize HARKing or p-hacking, we clearly separated data exploration from statistics. Where data exploration used to be limited to a single bar chart, we now add correlation analyses comparing one gene against another, or NRQ values against a numeric sample property like dose, age, or optical density.
Any exploration that reveals something of relevance, whether good (a potential signal for upregulated expression) or bad (a technical artifact), can now be saved. Stored analyses are not merely screenshots but actual snapshots, including all data and settings from the time of recording. This lets you build a list of recorded findings that is unaffected by any changes you might still make to the experiment.
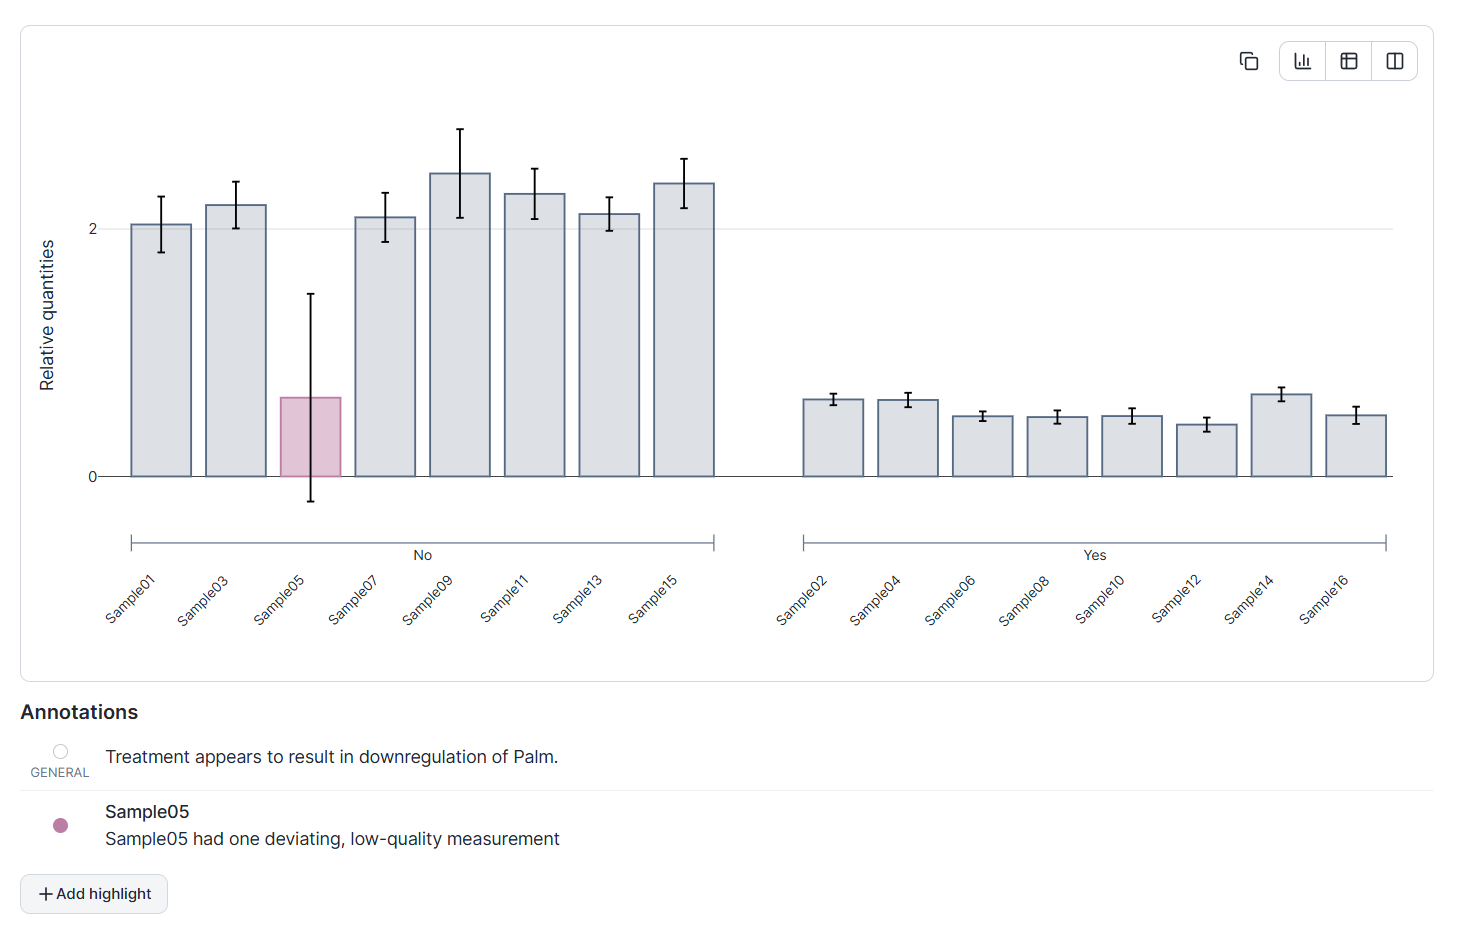
Exploration snapshots are an important building block for Clarida's planned reporting functionality. To make stored analyses truly meaningful, we added tooling to annotate the whole analysis as well as a selection of individual datapoints. Specific datapoints can be marked in color or with alternative symbols, each with a corresponding note attached like a legend, so a saved analysis carries its own visual commentary. When you want to iterate, create an editable copy with a link back to the original, leaving the first record intact.
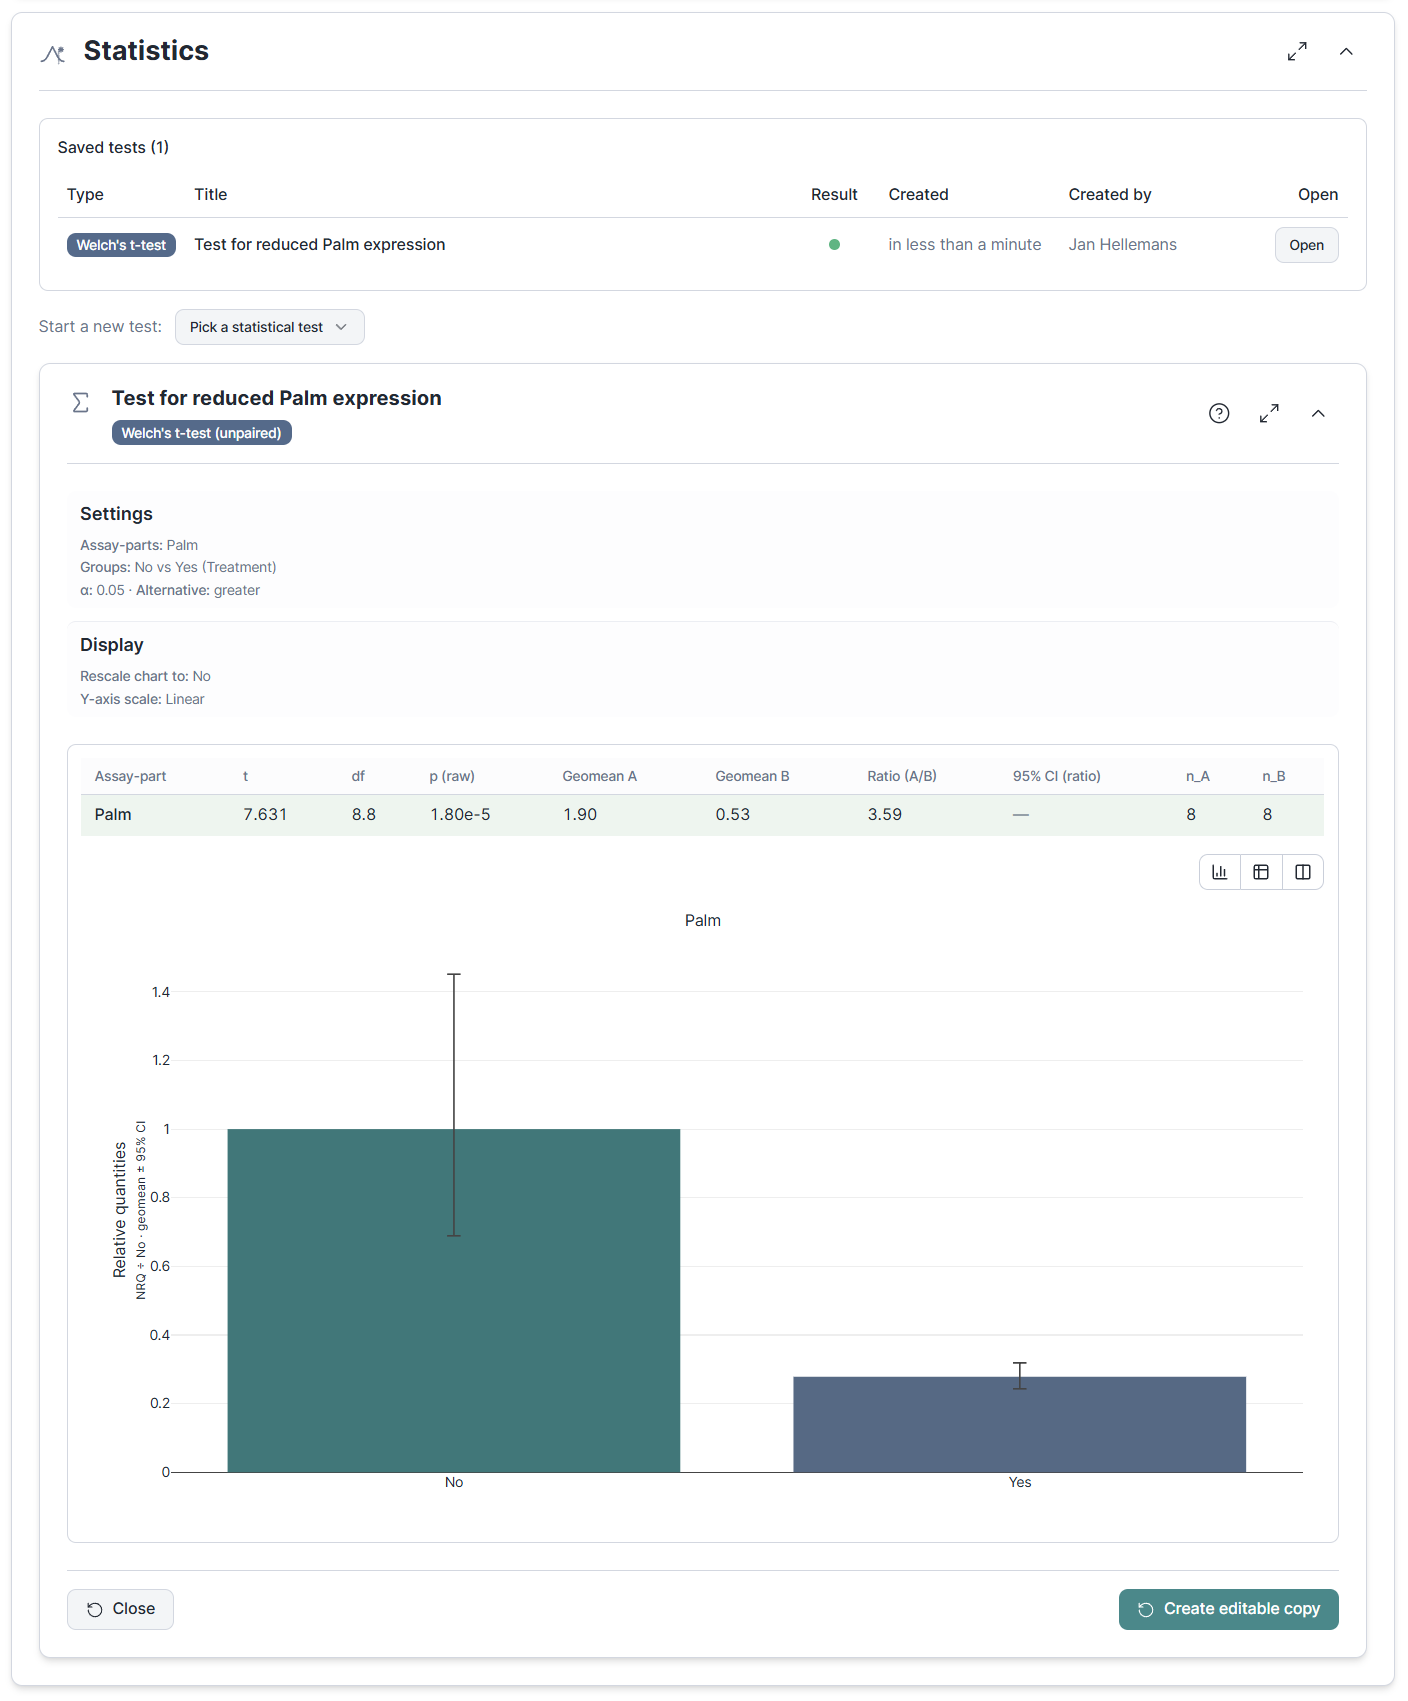
Essential statistical tests
The Statistics section now hosts eight formal tests covering the cases most qPCR papers need: Welch's and Student's t-tests, the paired t-test, the Wilcoxon signed-rank and Mann-Whitney U non-parametric alternatives, one-way ANOVA with post-hoc comparisons, and Pearson / Spearman correlations across multiple gene pairs with per-pair confidence intervals and multi-testing correction.
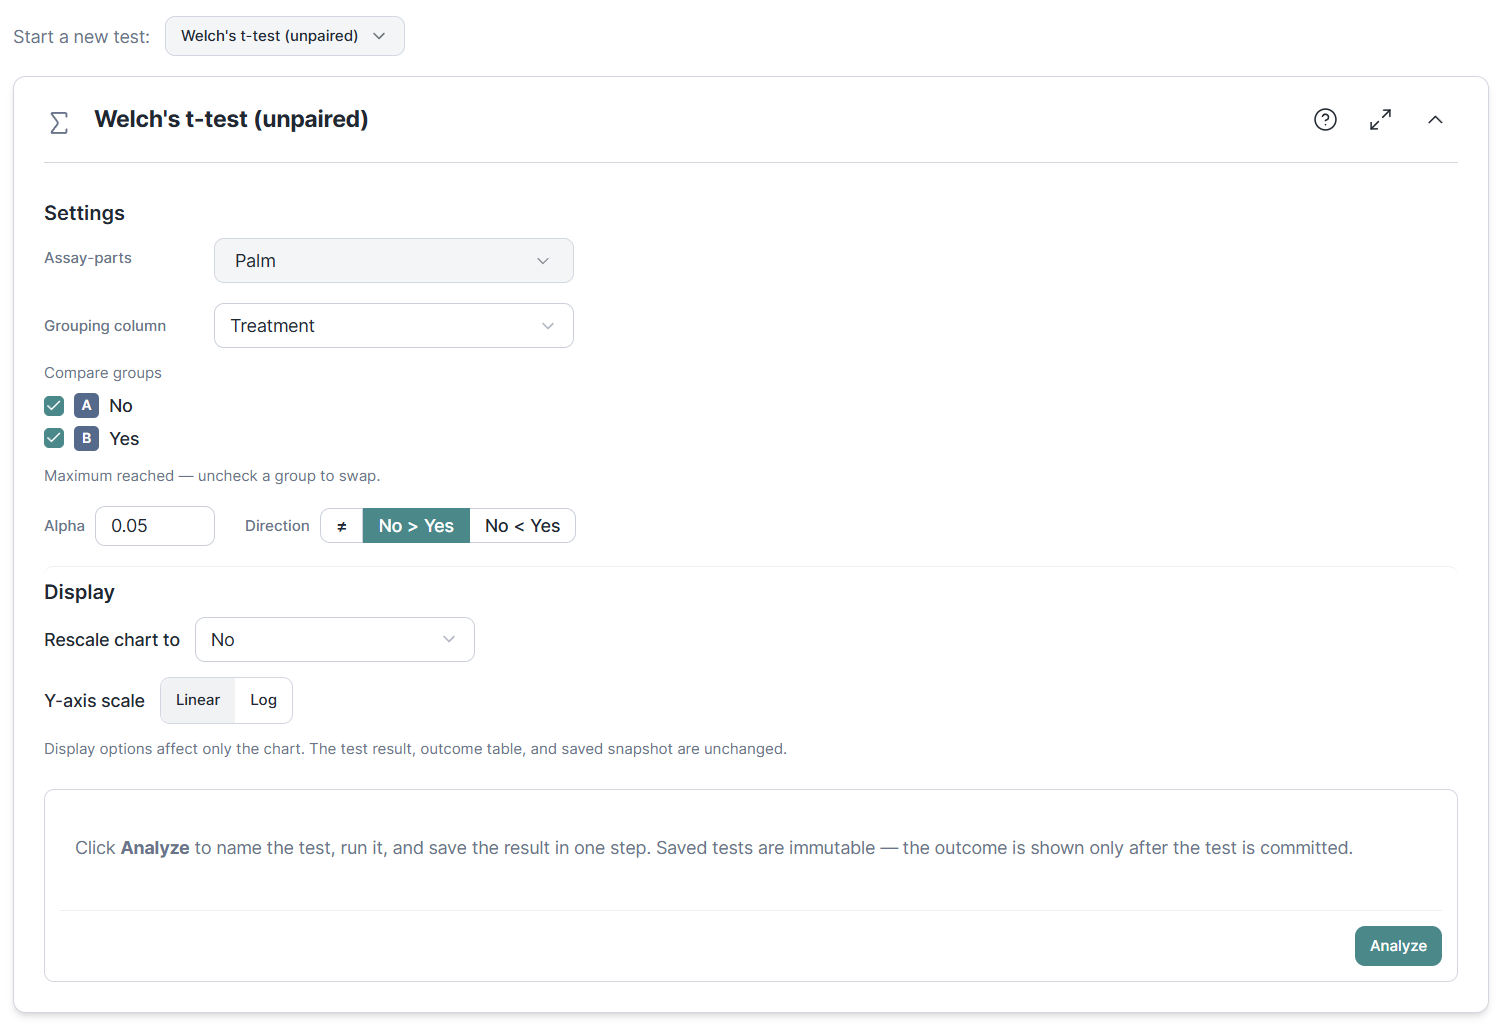
Tests are click-to-compute by design: you pick a test, set it up, and click Analyze to compute and save the result in one step. Unlike explorations, there is no live view recomputing as you tweak settings, which keeps the workflow honest and free of accidental p-hacking. And like explorations, statistical analyses are stored in a list of results, ready for reinspection or reporting.
Quality of life
- Always-consistent results · A new recalculation coordinator guarantees that downstream results always reflect your latest upstream inputs, while cutting redundant recomputation when you reopen an experiment, so the analysis is both correct and noticeably snappier.
- Fullscreen workflow sections · Section navigation was rebuilt to support a fullscreen wizard mode, so you can focus on one workflow step at a time without the surrounding context as a distraction.
- Soft-delete for experiments · Experiments can now be deleted from the experiment overview via the three-dot menu. This allows for maintenance and cleanup while soft-delete prevents unrecoverable data loss.
- Inline run renaming · Rename a run directly in Annotation Review and the new name propagates live across the workflow. Ideal for a clear inter-run calibration view where clear short names may be preferred over long, generically generated run names.
- Clear processing feedback · Workflow sections now show a spinner while they recompute, so you always know when results are still settling.
- Process larger experiments · The cap of 1000 datapoints per experiment has been removed, so you can correctly process larger experimental datasets.
- Rescale to group · The result scaling options have been expanded to include scaling to a group, e.g. setting the average pre-treatment levels to one to help interpretation of the post-treatment values.
- Clearer chart axes · The y-axis on the expression and normalization charts now picks readable, evenly spaced values on both linear and log scales, instead of crowding or collapsing to a single label when your data spans a very wide or very narrow range.
Plans and billing
Clarida now has paid plans you can set up yourself, right from Settings → Billing. No sales email required to get past the free tier.
- Pay-as-you-go credits · Buy experiment credits via Stripe Checkout and run experiments paid from a shared per-organization balance, with optional auto-recharge so you never get blocked mid-experiment.
- Lab subscriptions · Choose a Lab Academic or Lab Commercial subscription with the included experiment volume that fits your group, billed monthly or yearly, with quota that resets each period.
- One pricing surface, everywhere · The same pricing calculator you see on the website now lives inside the app, wired to authenticated checkout, and the billing page reads the same way whether you are Freemium, pay-as-you-go, or subscribed.
The free tier still includes the same functionality and allowance provided to individual researchers.
Patch 2026.6.1
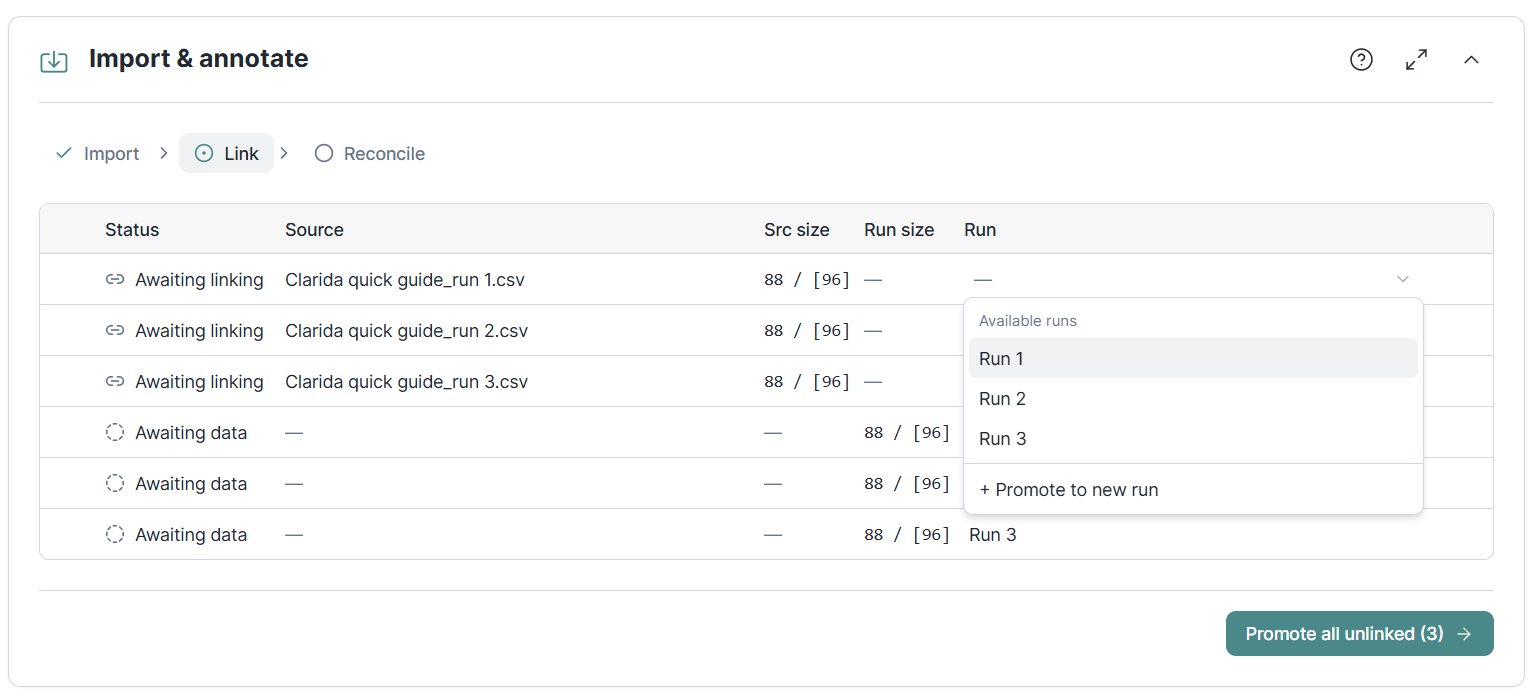
One clear path to bring your data in
Getting instrument data into an experiment used to span two separate sections, "Import data" and "Annotation review" causing a confusing user experience, especially when that review felt irrelevant. In this release we have collapsed them into a single, progressive Import & annotate section with three explicit steps: import your files, link each imported run to the right run in your design, and reconcile anything that needs a decision. You can see at a glance what was detected, what still needs your attention, and what is already done.
The rework also closes a set of bugs and surprising behaviors of the application. The result is that the platform's core "bring your data in" path behaves the same way every time, with nothing silently happening behind the scenes.
For a full account of what the importer reads and how the one-to-three import steps adapt to your experiment, see Importing instrument data in our methods library.
Quality of life
- A clearer first run · New accounts now land on a focused starting page with demo experiments you can open right away and an unambiguous choice between bringing your own data and exploring an example. This makes it easier for new users to get started with Clarida.
- Reference Gene Finder · The free Reference Gene Finder now allows you to exclude specific samples or genes directly in a grid before running geNorm. This removes the need for manual re-editing of your data outside the tool when having to remove bad data.
- Recoverable run delete and reliable restore · Deleting a whole run now snapshots its design first, so the action is recoverable, and restoring a snapshot writes data back correctly.
- Footer navigation · The qPCR footer subsection row now shows correctly when a main section is active.
Changes that may affect you
Inter-run calibration is on by default for new experiments. When the same biological sample is measured for a given assay on more than one plate, new experiments now produce calibrated quantities (CNRQ) automatically, removing per-plate technical offsets. This is a more correct number than before, when CNRQ equaled NRQ regardless of plate layout. You can turn inter-run calibration off if you prefer to keep working with uncalibrated data.
Existing experiments are unchanged. Inter-run calibration defaults to off for experiments created before this release, so your historical CNRQ values are numerically identical to what they were. You can enable calibration per experiment from the analysis settings and recompute when you are ready.
Migration: No action needed. To apply calibration to an older multi-plate experiment, toggle inter-run calibration on in its analysis settings and the quantification pipeline will recompute.