Once a qPCR run has been processed into relative quantities and checked for quality, the interesting work begins: figuring out what the numbers say. Is the target up or down in the treated group? Do two genes move together across samples? Does expression track a dose, an age or some other measured property? This is exploration: open-ended looking, before any formal claim is made.
Exploration sits after quality control, and the two differ in kind. QC asks fixed questions with clear expectations (is this normalization factor an outlier? did the positive control land in range?), whereas exploration is open-ended, which is why it follows QC rather than absorbing it.
How to covers building a view in Exploration, saving it and annotating it; How it works explains why exploring is kept apart from statistical tests, and what a saved analysis keeps.
How to
1. Build a view in Exploration
Open Exploration and pick one of its three views:
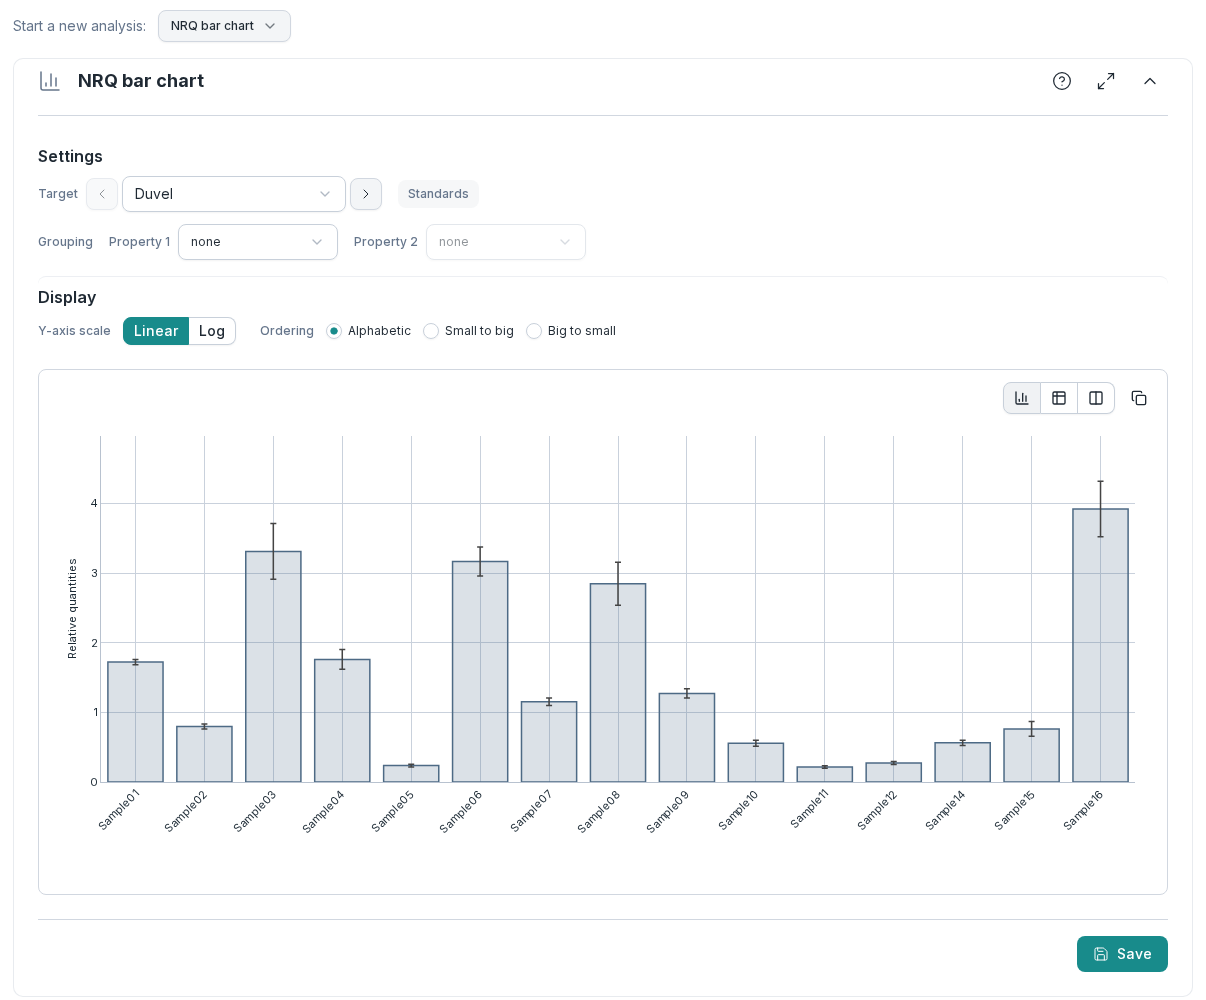
- NRQ bar chart: the relative quantities of one target, per sample. Group the bars by a sample property, switch the Y-axis scale between linear and log, and change the Ordering of the bars.
- Gene–gene correlation: the relative quantities of two targets, one point per sample, to see whether they co-vary. This also checks that a candidate reference gene is flat against the others.
- NRQ–sample correlation: the relative quantities of a target against a numeric sample property such as dose, age or optical density.
The chart redraws with every setting you change.
2. Save the view
When a view shows something worth keeping, choose Save and give it a Title. It joins Saved explorations, the list above the chart, as a snapshot of the data and every setting at that moment. See Snapshots, not screenshots.
To try a variant of a saved view without losing it, open it and choose Create editable copy. The copy keeps a link back to the original, which stays as it was.
3. Annotate it
Open the saved analysis. Under Annotations, write a general note about the figure: the message it should carry. Then choose Add highlight to single out datapoints with a color (and on a scatter chart, a symbol), each with its own note, so an outlier comes with its explanation attached.
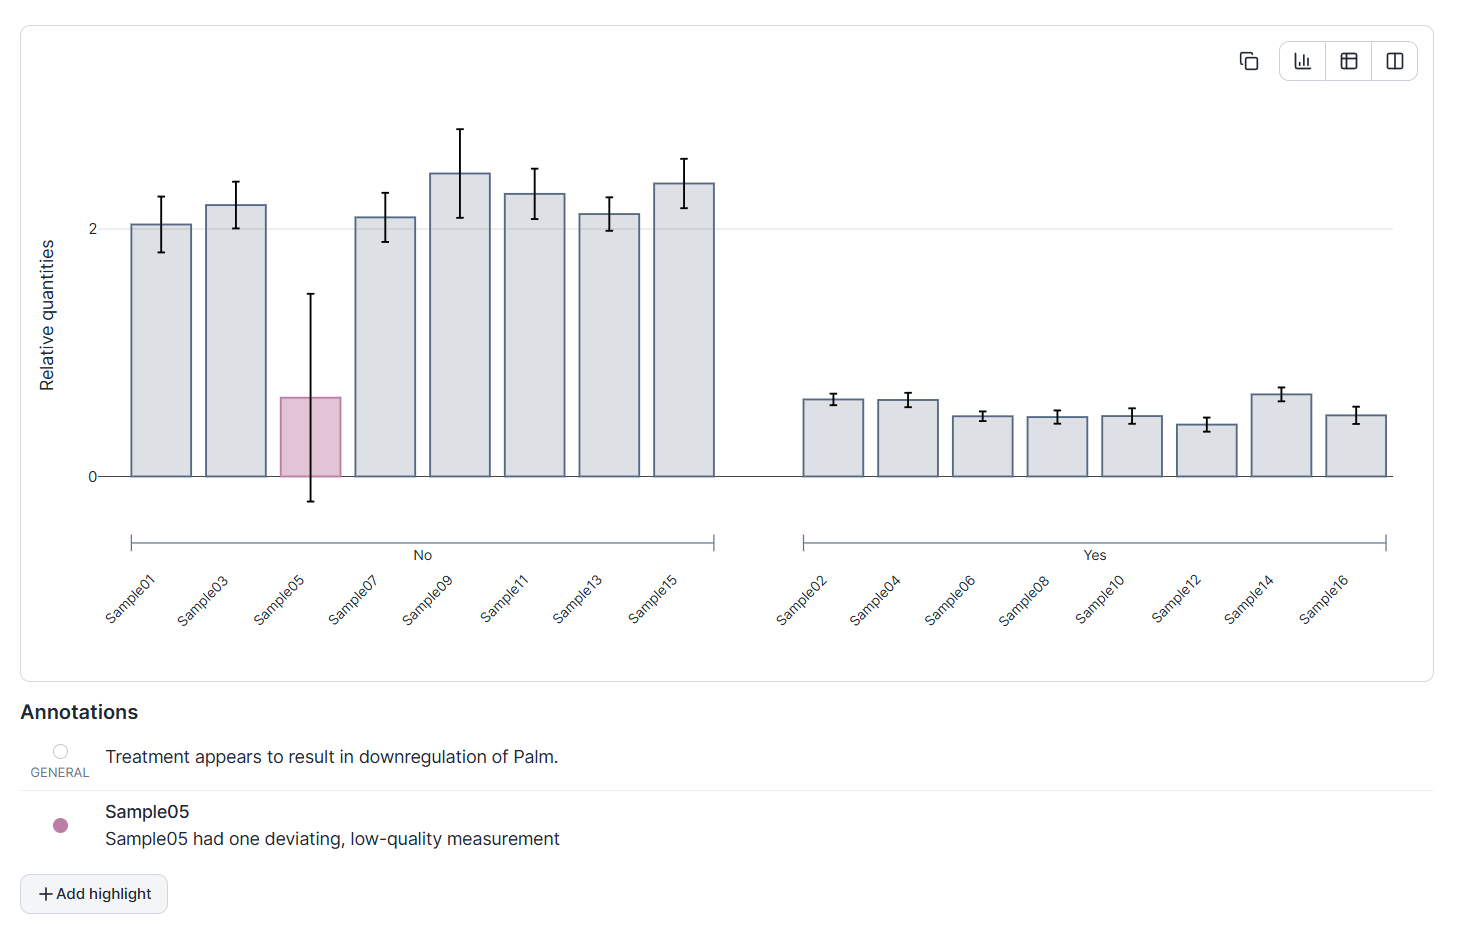
Notes and highlights stay editable after saving; the data and settings of the analysis do not. See An analysis that carries its own message.
How it works
Why exploring is kept apart from testing
Re-running a test while the analysis is adjusted raises the chance of a false positive. The literature calls it p-hacking (Simmons et al., 2011) and, when the hypothesis follows the result, HARKing, hypothesizing after the results are known (Kerr, 1998).
Exploration and statistics are separate stages in Clarida, and they behave differently on purpose:
- Exploration is live. Settings update the chart as you change them. This is right for forming a hypothesis and wrong for confirming one.
- Statistics is click-to-compute. You set up a test once, run it, and the result is saved with its settings and data intact. There is no live result: the test's outcome appears only once you run and save it. Trying a different configuration means creating a new, separately recorded analysis.
So a test result never moves with the settings, and each one you see is on record.
Snapshots, not screenshots
An exploratory view is only useful later if you can get back to exactly what you saw. A screenshot captures pixels but not provenance: change the experiment afterward and the screenshot becomes a picture of data that no longer exists.
Clarida saves explorations as snapshots. A stored analysis captures all the underlying data and every setting at the moment of saving, so nothing you change in the experiment afterward affects it. You build up a list of recorded findings (a signal worth following up, a technical artifact worth remembering), each one a stable, self-contained record. Because the data is frozen with it, a saved analysis is a result you can point back to.
An editable copy is a new line of inquiry beside the first record, which stays intact. A saved analysis goes into the report unchanged, in the Report builder, with no re-creation step.
An analysis that carries its own message
A frozen chart still leaves the most important thing unsaid: what you noticed, and why it matters. So a stored analysis can be annotated, much like the legend of a figure in a paper: a note on the analysis as a whole, and highlighted datapoints with a note each. The result is a chart that travels with its own commentary: not just what the data showed, but what you concluded and which points led you there.
The loop runs from open-ended looking, to a frozen record, to one that says something. A passing observation at the screen becomes a lasting piece of evidence, and the line between exploring the data and testing a claim about it stays in place.