January 6th, Epiphany. A fitting day to launch something we've been turning over in our heads for a long time: the realization that scientists deserve better tools than scattered spreadsheets and copy-paste workflows. So here we are. Clarida is live, and this is what shipped on day one.
It's not much but it is a start. We are planning for much more but are releasing this to start showing our vision. Perhaps our Lab workbook templates or the Plate homogeneity app may already be of help to you.
We're just getting started.
Jan
New features
Plan an experiment and export it to Excel
Preparation is the step that tends to get rushed. We built it into the analysis tool because what you define at the start is what you need again when you report.
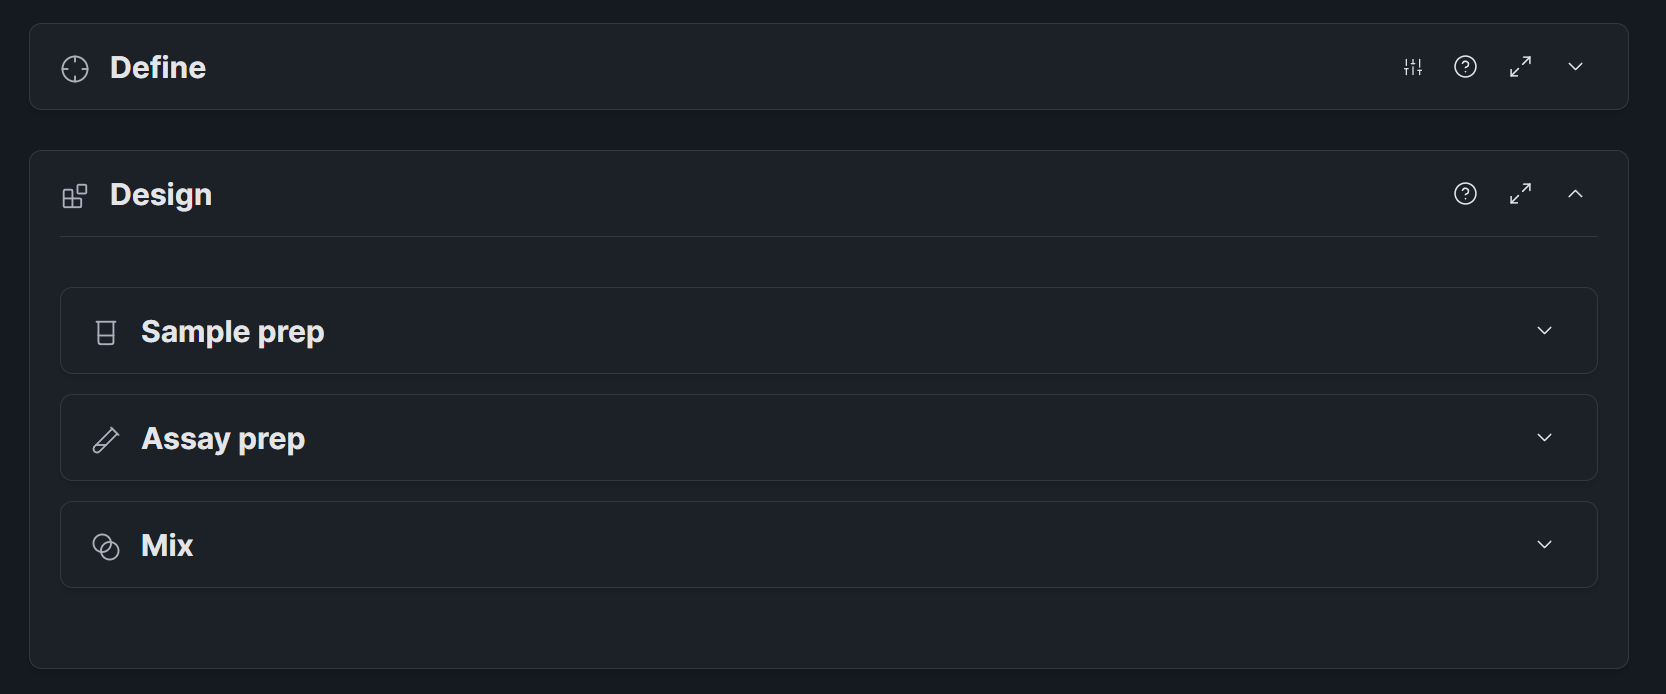
Define your samples, configure your assays, calculate master mix volumes, and export the complete design to Excel. Ready for the bench.
Bring structure to your Excel files
Excel lets you set up and analyze an experiment in whatever way suits you, so no two files look alike. The Lab workbooks tool brings structure and consistency to your lab notes.
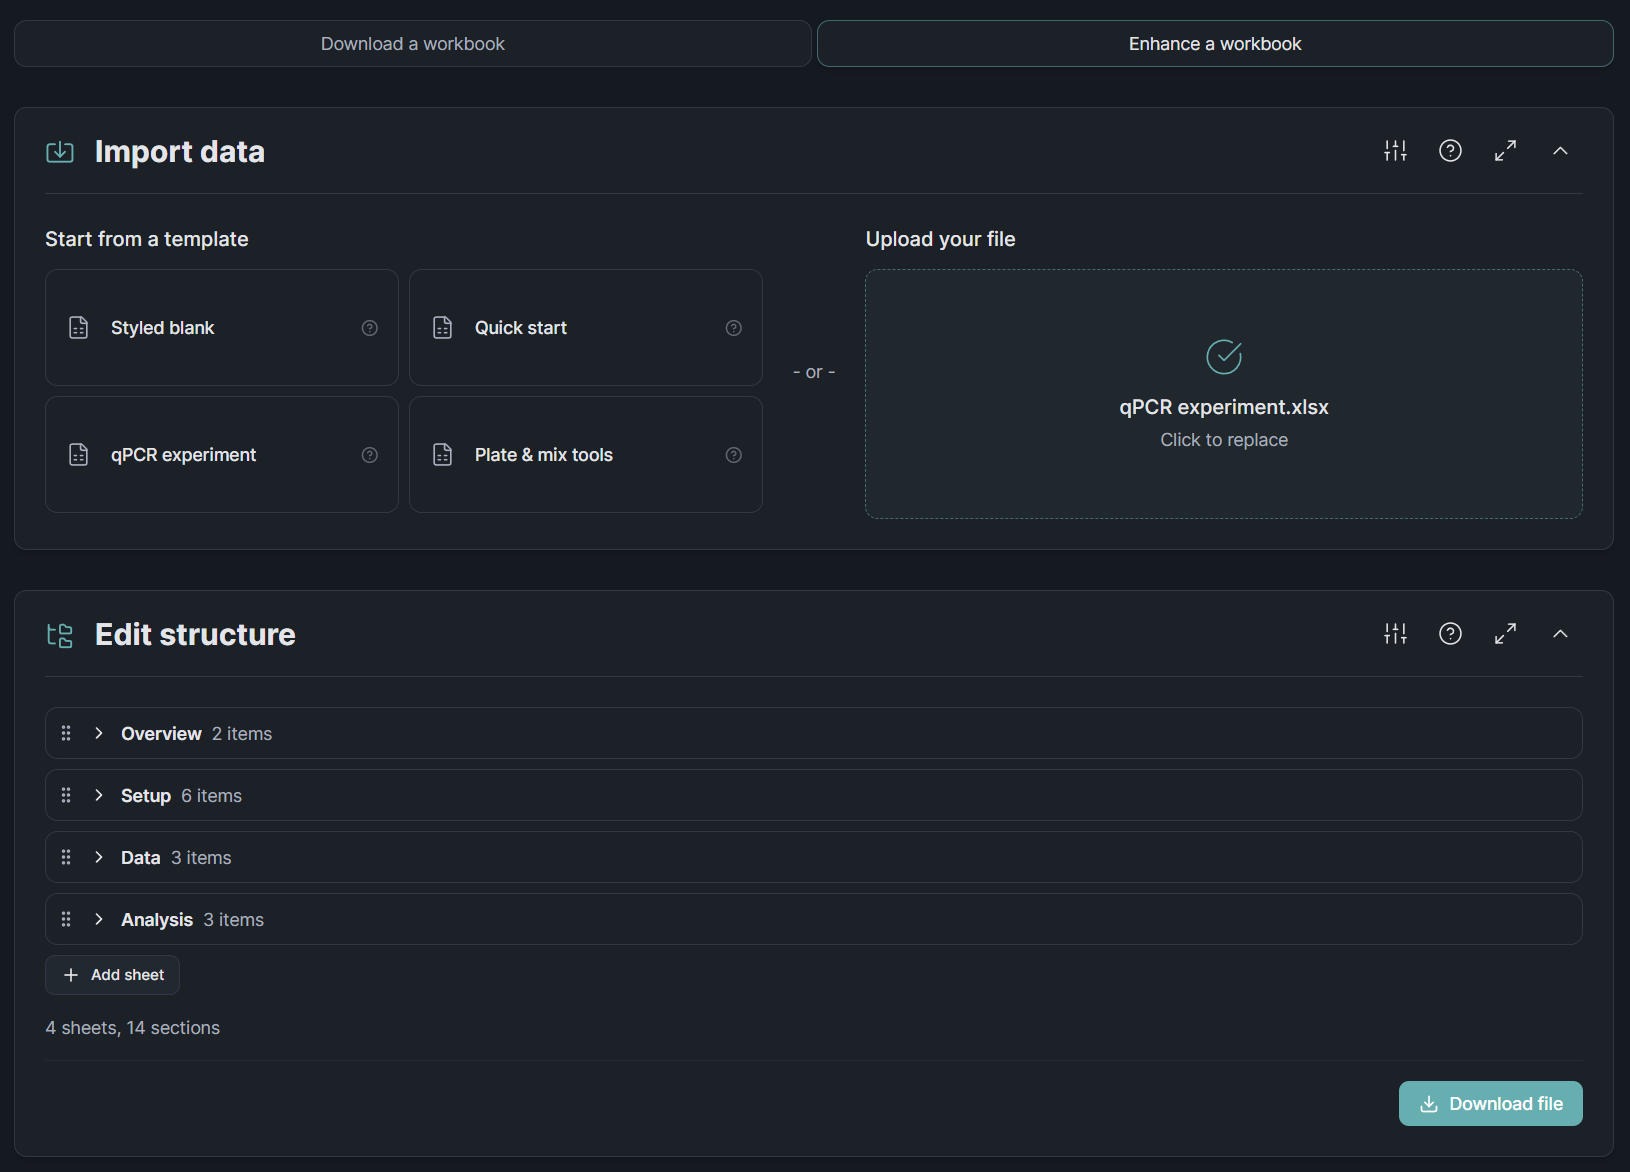
Consistent styling, headers, color coding, and named ranges, all applied in one step so your files are analysis-ready without reformatting. Need a fresh template instead? That generates in under two seconds.
Check plate homogeneity on an instrument
The plate homogeneity tool is now available to all. Upload your plate data and see exactly where your wells deviate.
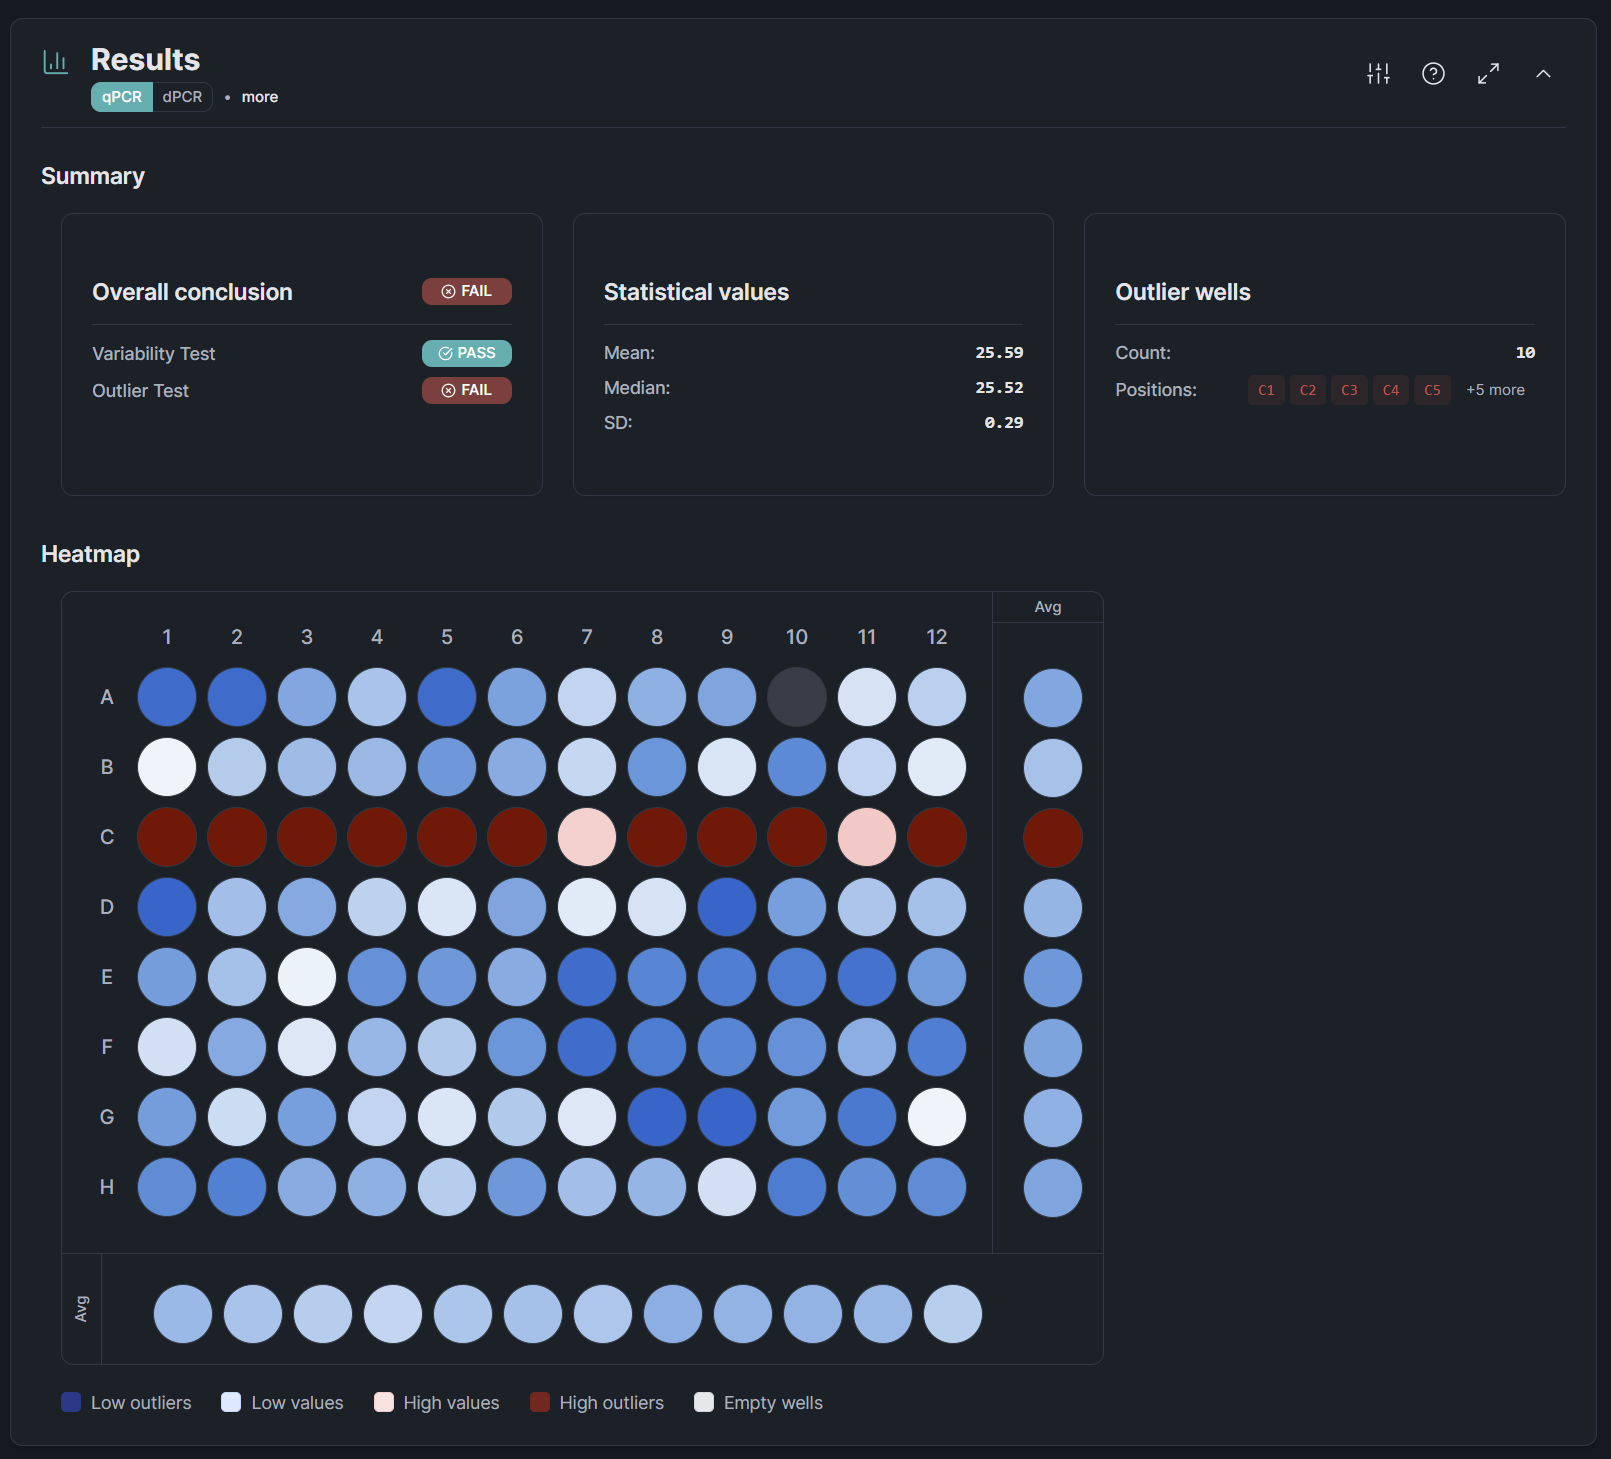
Set your QC thresholds, inspect the heatmap, and drill into individual wells, all without leaving Clarida.
Quality of life
- Share feedback without leaving the app · A sidebar button lets you report bugs, request features, or ask questions. Your feedback becomes a tracked issue on our end.
- Deployed in Amsterdam · Your data stays in the EU: Clarida runs on infrastructure in the Netherlands.