Every new Clarida workspace comes with this example: a treatment study with two independent groups, 16 samples, 8 untreated and 8 treated. Three genes of interest were measured together with three candidate reference genes, in duplicate, on three plates, with a dilution series of five standards and a no-template control. Sample and gene names are illustrative.
Normalization divides every measurement by a factor computed from the reference genes, so a result is only as good as those genes. In this example, all three candidates start included. Step 2 shows whether they should be.
It is your workspace's copy: colleagues in the workspace see the same one. You can explore every analysis step and change how results are shown; the measured design (samples, targets, plates) is locked so the example stays intact.
How to
1. Open the example and read its goal
Open the unpaired comparison example: a card on your home page or, once you have an experiment of your own, in the experiment list with the Example badge. The experiment opens on Define: the Background describes the study, and the Goal says what it sets out to answer.

What to notice: the Goal has two parts, and the order matters: first choose the reference genes, then look at the genes of interest. Scroll down inside the Background box for the places worth visiting. Above the experiment, the Demo experiment banner says what you can do: analysis, annotations and reporting all work; structural edits are locked.
2. Spot the unstable candidate
Go to Analyze → Cq processing → Normalization. The table lists the three candidate reference genes with two stability measures: M (the geNorm stability value) and CV (%), the coefficient of variation. Lower is more stable for both. The chart below shows the normalization factor of every sample.
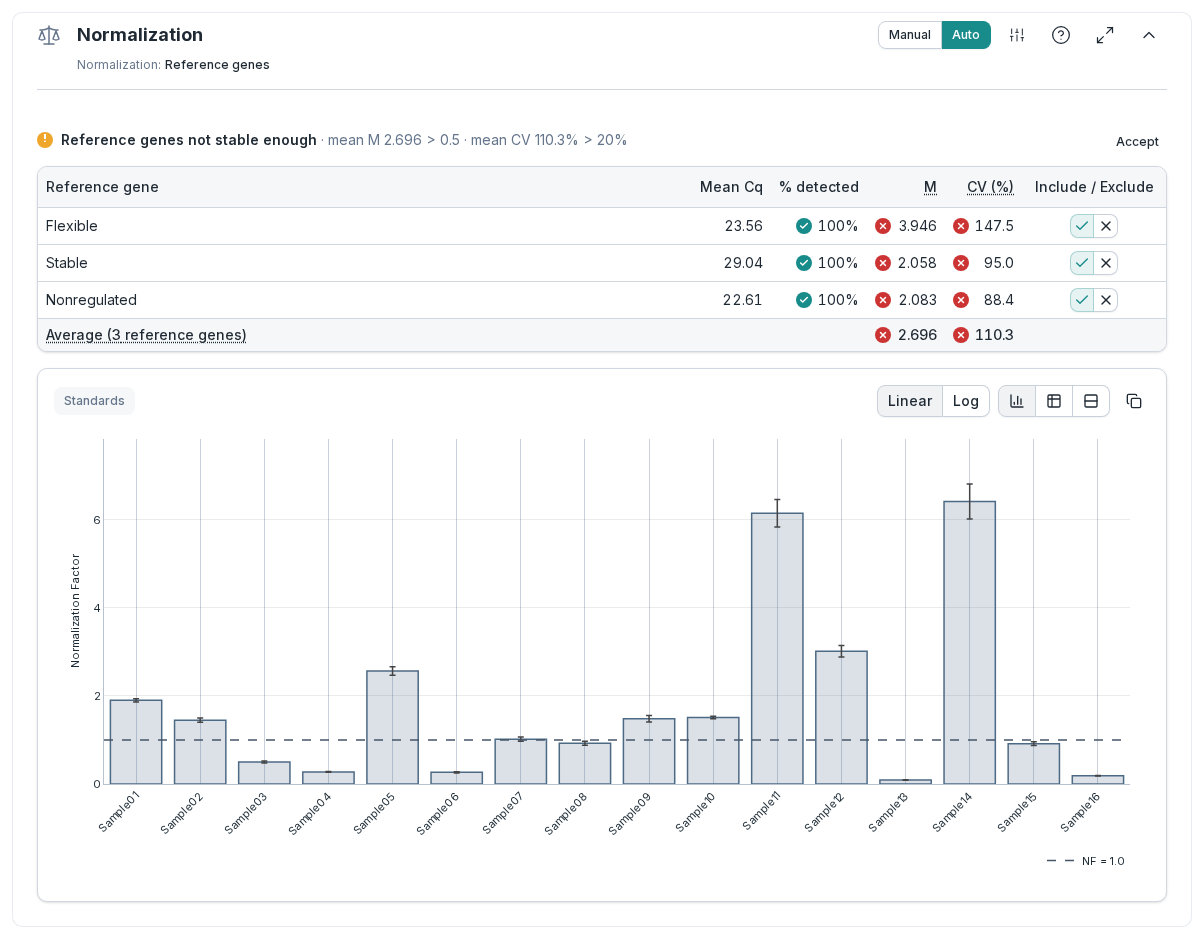
What to notice: Clarida warns Reference genes not stable enough: the mean M is 2.70, above the 0.5 cut-off, and the mean CV is 110%, against 20%. One candidate stands out: Flexible, with an M of 3.95 and a CV of 148%. The other two look poor as well, but a gene's M is measured against the other reference genes, so one unstable gene drags every value up.
3. Leave it out
In the Include / Exclude column, click the cross on the Flexible row. Clarida recalculates the stability of the remaining genes and every normalization factor straight away.
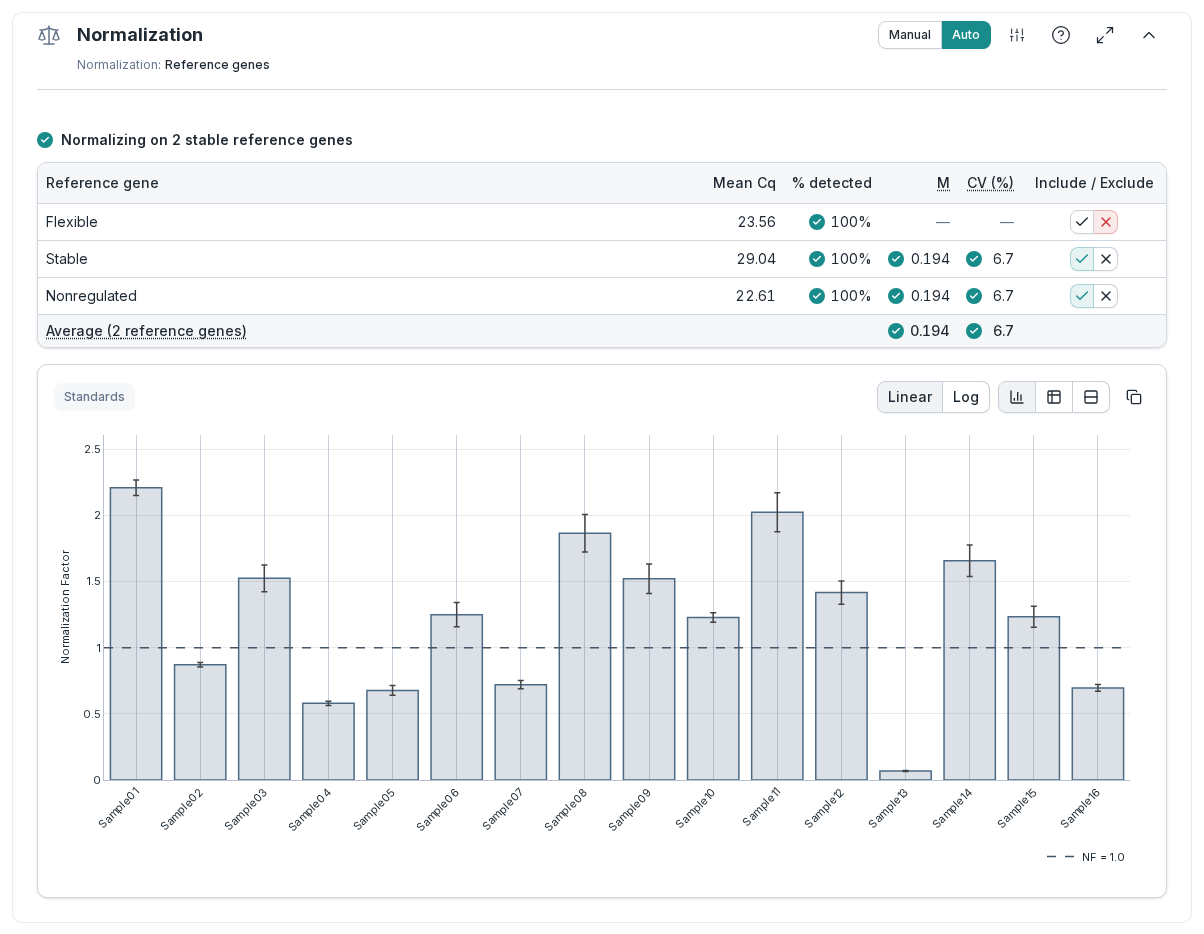
What to notice: the warning turns into Normalizing on 2 stable reference genes. Without Flexible, the mean M drops from 2.70 to 0.19 and the mean CV from 110% to 6.7%: Stable and Nonregulated agree closely. The normalization factors change too. Sample11 and Sample14 seemed to have about six times the average input; with two stable reference genes it is about twice. Flexible stays in the table, so you can include it again at any time.
4. Compare the two groups
Go to Exploration. The NRQ bar chart shows the first gene. Under Grouping, set Property 1 to Treatment and choose Plot group average. Then use the arrows next to Target to step through the three genes of interest.
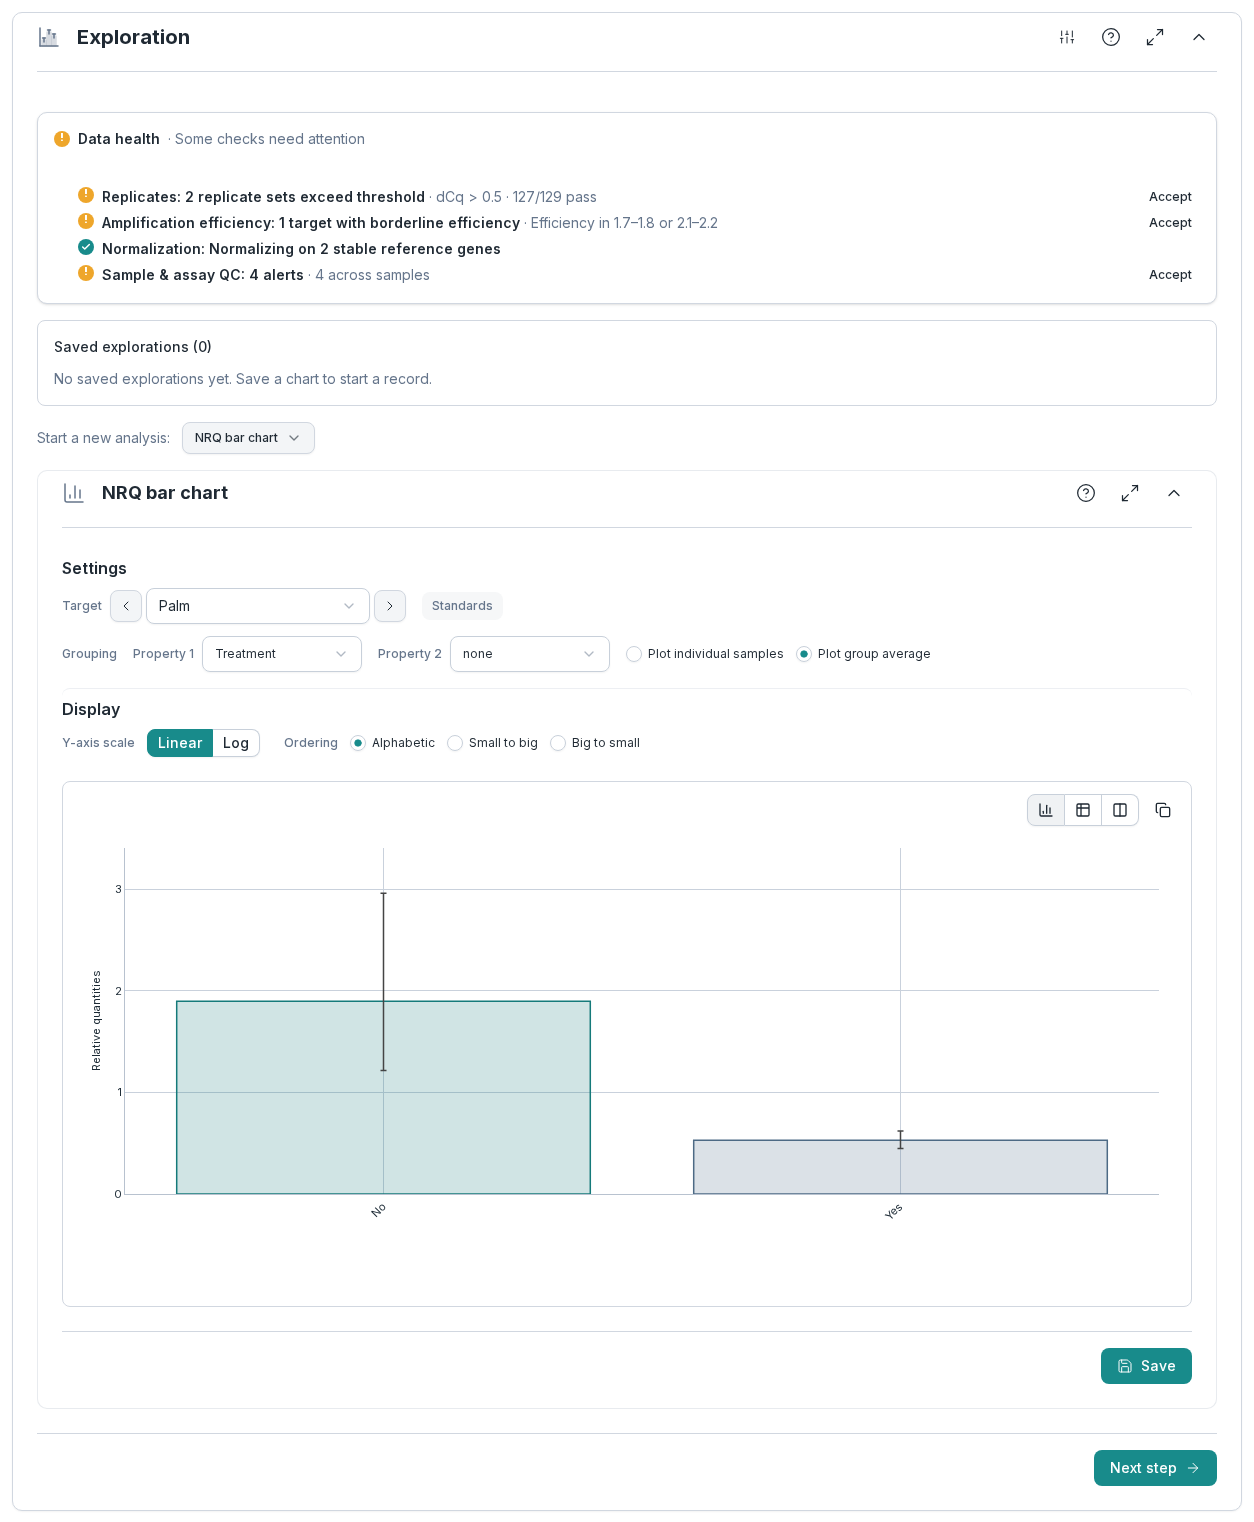
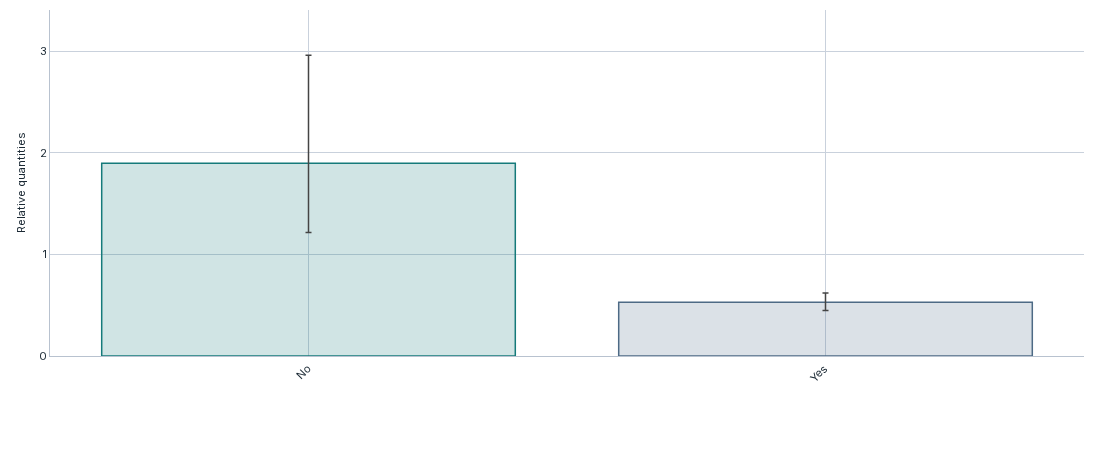
What to notice: for Palm, the treated group is about 3.6 times lower than the untreated group (1.9 against 0.5; the Ratio (A/B) column shows 3.584). Duvel and Leffe barely differ between the groups.
The Data health summary at the top collects the checks this result rests on, and three are orange:
- Sample & assay QC, 4 alerts: the unequal input from step 3. Sample01, Sample11 and Sample13 have normalization factors outside the 0.5 to 2 range, and Sample13, with the least input, also has a high average Cq. Normalization corrects for this.
- 2 replicate sets exceed threshold: in Sample05 for Palm and in Standard5 for Leffe, one of the two replicates is almost 4 cycles away from the other.
- 1 target with borderline efficiency: Leffe, at 1.74, pulled down by that deviating Standard5 replicate.
The alerts ask you to take a look; they don't mean the analysis failed. The two deviating replicates are a good place to start; see below.
Try this
With the result in view, change one thing and watch the analysis follow.
- Bring Flexible back. Include it again in Normalization, then return to the Palm chart. How much of the difference between the groups survives an unreliable reference gene?
- Exclude the deviating replicates. Under Cq processing → Exclusion, exclude well A10 (Sample05, Palm) and well H10 (Standard5, Leffe). Watch the replicate and efficiency checks turn green, then return to the Palm chart. Does the difference between the groups change?
- Look at every sample. Switch from Plot group average to Plot individual samples to see how much the eight samples within each group vary.
- Change the scale. Set the Y-axis scale to Log, so a twofold increase and a twofold decrease look the same size.
What you just did
- Checked the stability of three candidate reference genes.
- Left out the one that could not be trusted, and saw the others turn stable.
- Saw how the normalization factors change with the reference genes.
- Compared the treatment groups for each gene of interest.
To do the same on your own run, Importing qPCR run files and Cq (Ct) tables says which exports Clarida reads and how they are matched.