The rules that hold
- A saved report never changes. Downloading it again gives the same report; a later edit becomes its next version.
- Its methods come from what you did. The sentences name the settings set the analysis started from, the reference genes and each test with its correction.
- RDML is checked before you download it. A file that fails the official RDML 1.3 schema is not handed out.
In this step
01In the app: Report builder › Outline
Start from a template, then make the outline yours
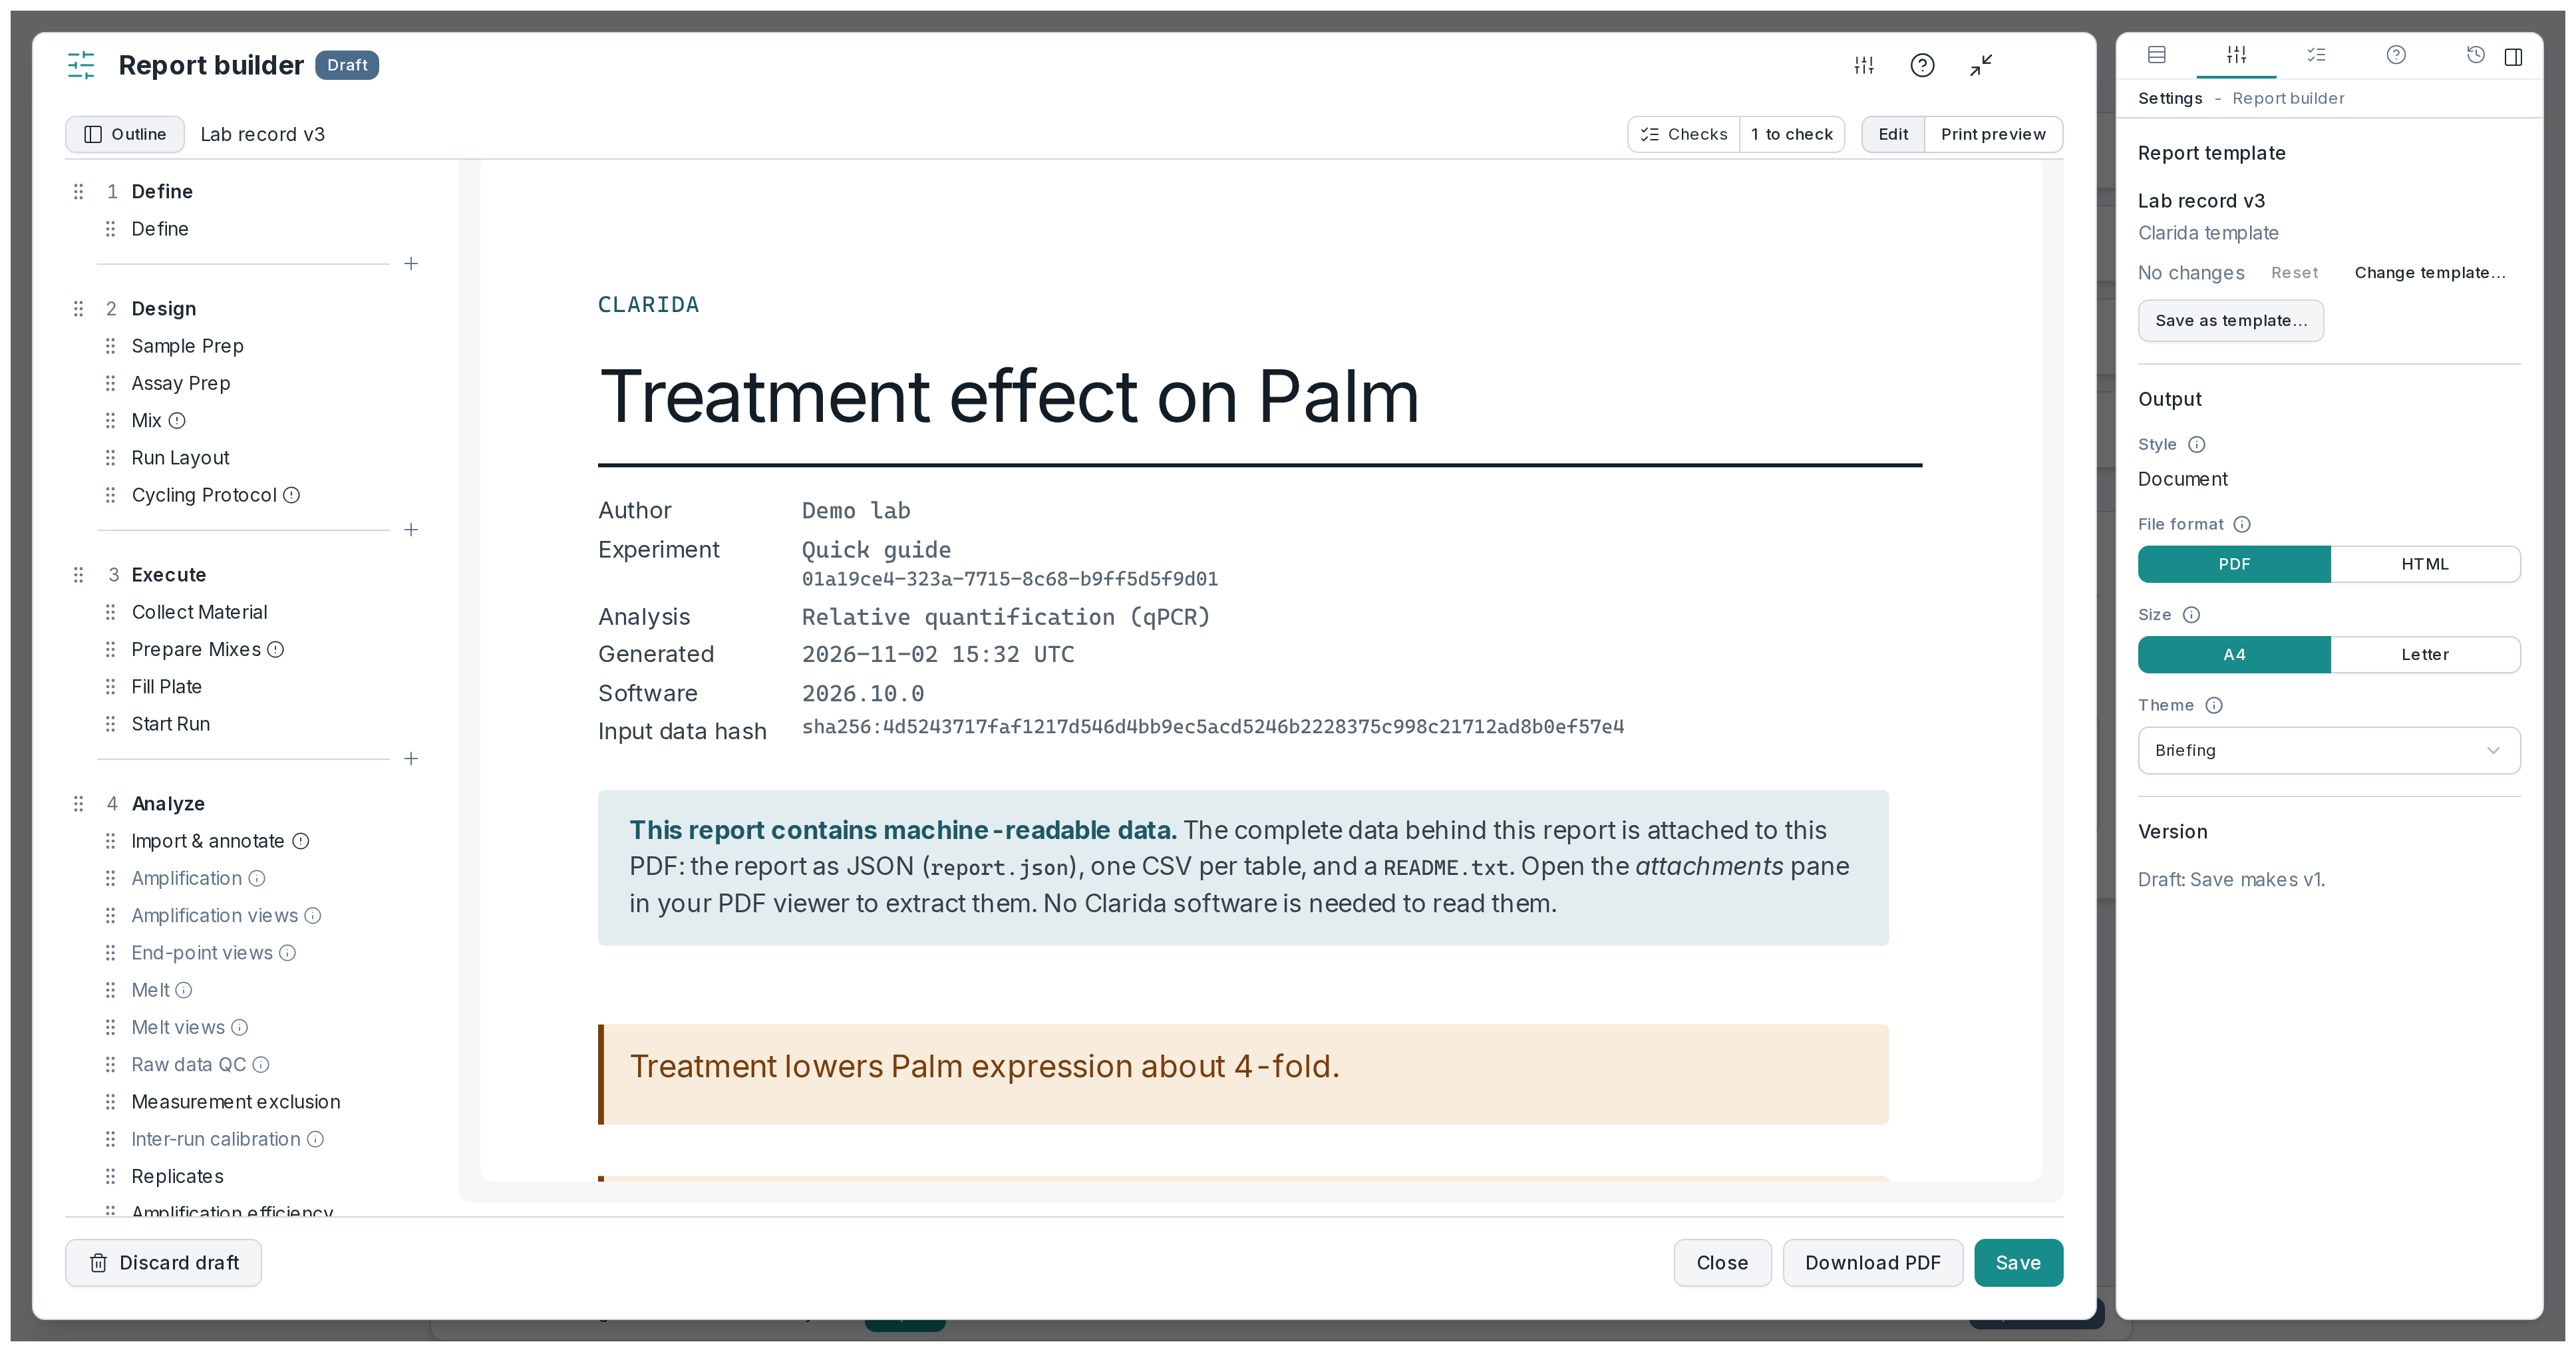
Pick a template: Lab record, Manuscript, Lab meeting, Execute or Reference gene finder, or one your lab saved. It sets the outline: headings, and the parts of the experiment under them. Move, rename, add or remove them; the report is shown as you build it, as the file you download will look. A part with nothing recorded yet says so in the report. Your saved analyses come in as they were saved, your notes as the caption, and a check lists any you left out.
Write a headline and a conclusion once: they open every report of the experiment. Add your own conclusion to any part; it carries your name.
- Per part: analysis settings, display settings, data and notes; a table, a figure or both; how many rows a table shows
- Order: your own outline, started from the template
- Format: PDF or HTML, on A4 or Letter
- Look: a theme for its colors, type and layout, saved with the report; a print preview shows the PDF as it will download
02In the app: Report builder
Methods in words, tables you can reuse
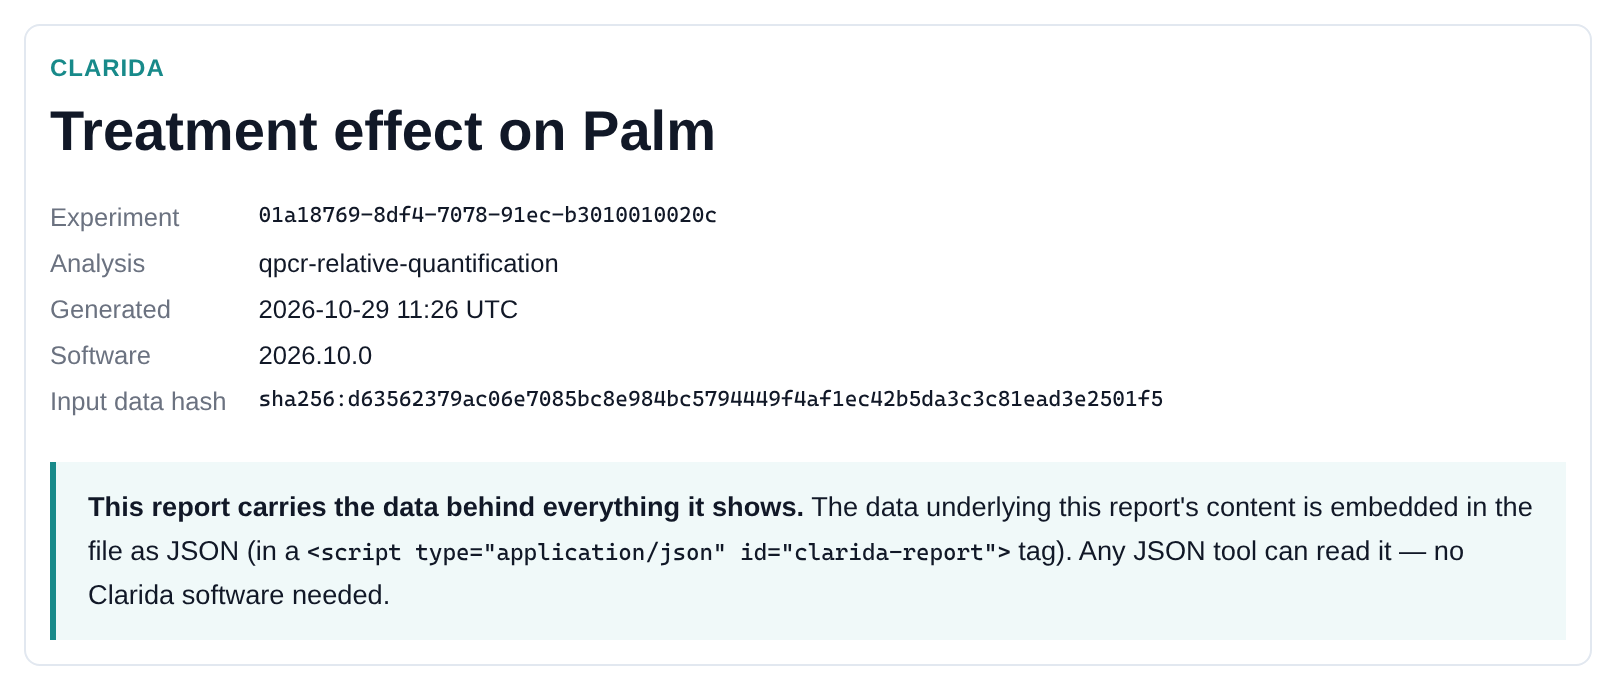
The report writes its methods as sentences from what you did: the settings set the analysis started from, the reference genes used and the ones left out, each test with its groups, significance level and correction. The PDF attaches every table as a CSV file and the full data as JSON, so a reviewer can check a number without retyping it. A long table can be shortened on the page; its CSV keeps every row. By default the header names the Clarida release and a fingerprint of the input data.
- Attached to the PDF: every table as CSV, the report data as JSON, and a short read-me
03In the app: Report builder
Saved reports keep every version
Download a draft whenever you like, or save the report with a title and its author. Before you download, the builder lists what to check: missing parts, out-of-date results, saved analyses left out. It never blocks the download. A saved report is never overwritten: a change becomes a new version next to the old one, and the builder offers a short note to paste into an email or a chat. The notebook and RDML export the experiment as it is now, so they can differ from a report saved last month.
- Save: a titled report, then new versions of it
- Share: the file, with a ready-made note to send with it
04In the app: Report › ELN workbook
The whole experiment in your Excel notebook
Export the experiment into an Excel notebook: Clarida’s, or your lab’s own attached in Define. It holds the overview with the background, goal and conclusion, the protocol, the bench work, the Cq values and relative quantities with their errors, the processing with its settings, the QC and the saved results. The export is there from Define onward, not only at the end.
05In the app: Report › RDML
RDML, to publish the runs with a paper
RDML is the open data standard for qPCR. Clarida exports samples, targets, runs, wells and Cq values, and the raw amplification and melt curves when they came in with the run, as RDML 1.3, checked against the official schema. It carries no analysis settings: those are in the report and the notebook.
What Report doesn’t do
| Word, PowerPoint and PDF/A | Reports are PDF or HTML; the tables come as CSV, the whole experiment as Excel |
|---|---|
| Signatures and share links | You send the file; no person signs a saved report |
| A MIQE checklist | The methods sentences say what was done; the builder checks the report is complete and current, but nothing checks the experiment against MIQE |
Frequently asked questions
How do you write the qPCR methods section for a paper?
Start from the report’s sentences: they name the settings set, the reference genes and each test with its correction, from what you did. Adapt them to your journal’s style; the tables come as CSV.
Is your data locked in?
No. The Excel notebook keeps the whole experiment, RDML the runs, and the PDF each table as CSV; the HTML report carries its data inside.
Is anything in the report written by AI?
No. The methods sentences are built by fixed rules from what you did, so they say exactly what was done.