The rules that hold
- The instrument’s values stay as they came. What you exclude or recalculate sits beside them.
- No exclusion without its reason. Each keeps whether you or a rule made the call, and a rule never overwrites yours. One click includes a well again.
- One Cq source per experiment. The instrument’s if any file has one, else Clarida’s. A blank imported Cq stays a negative; a file without Cq needs Clarida’s.
In this step
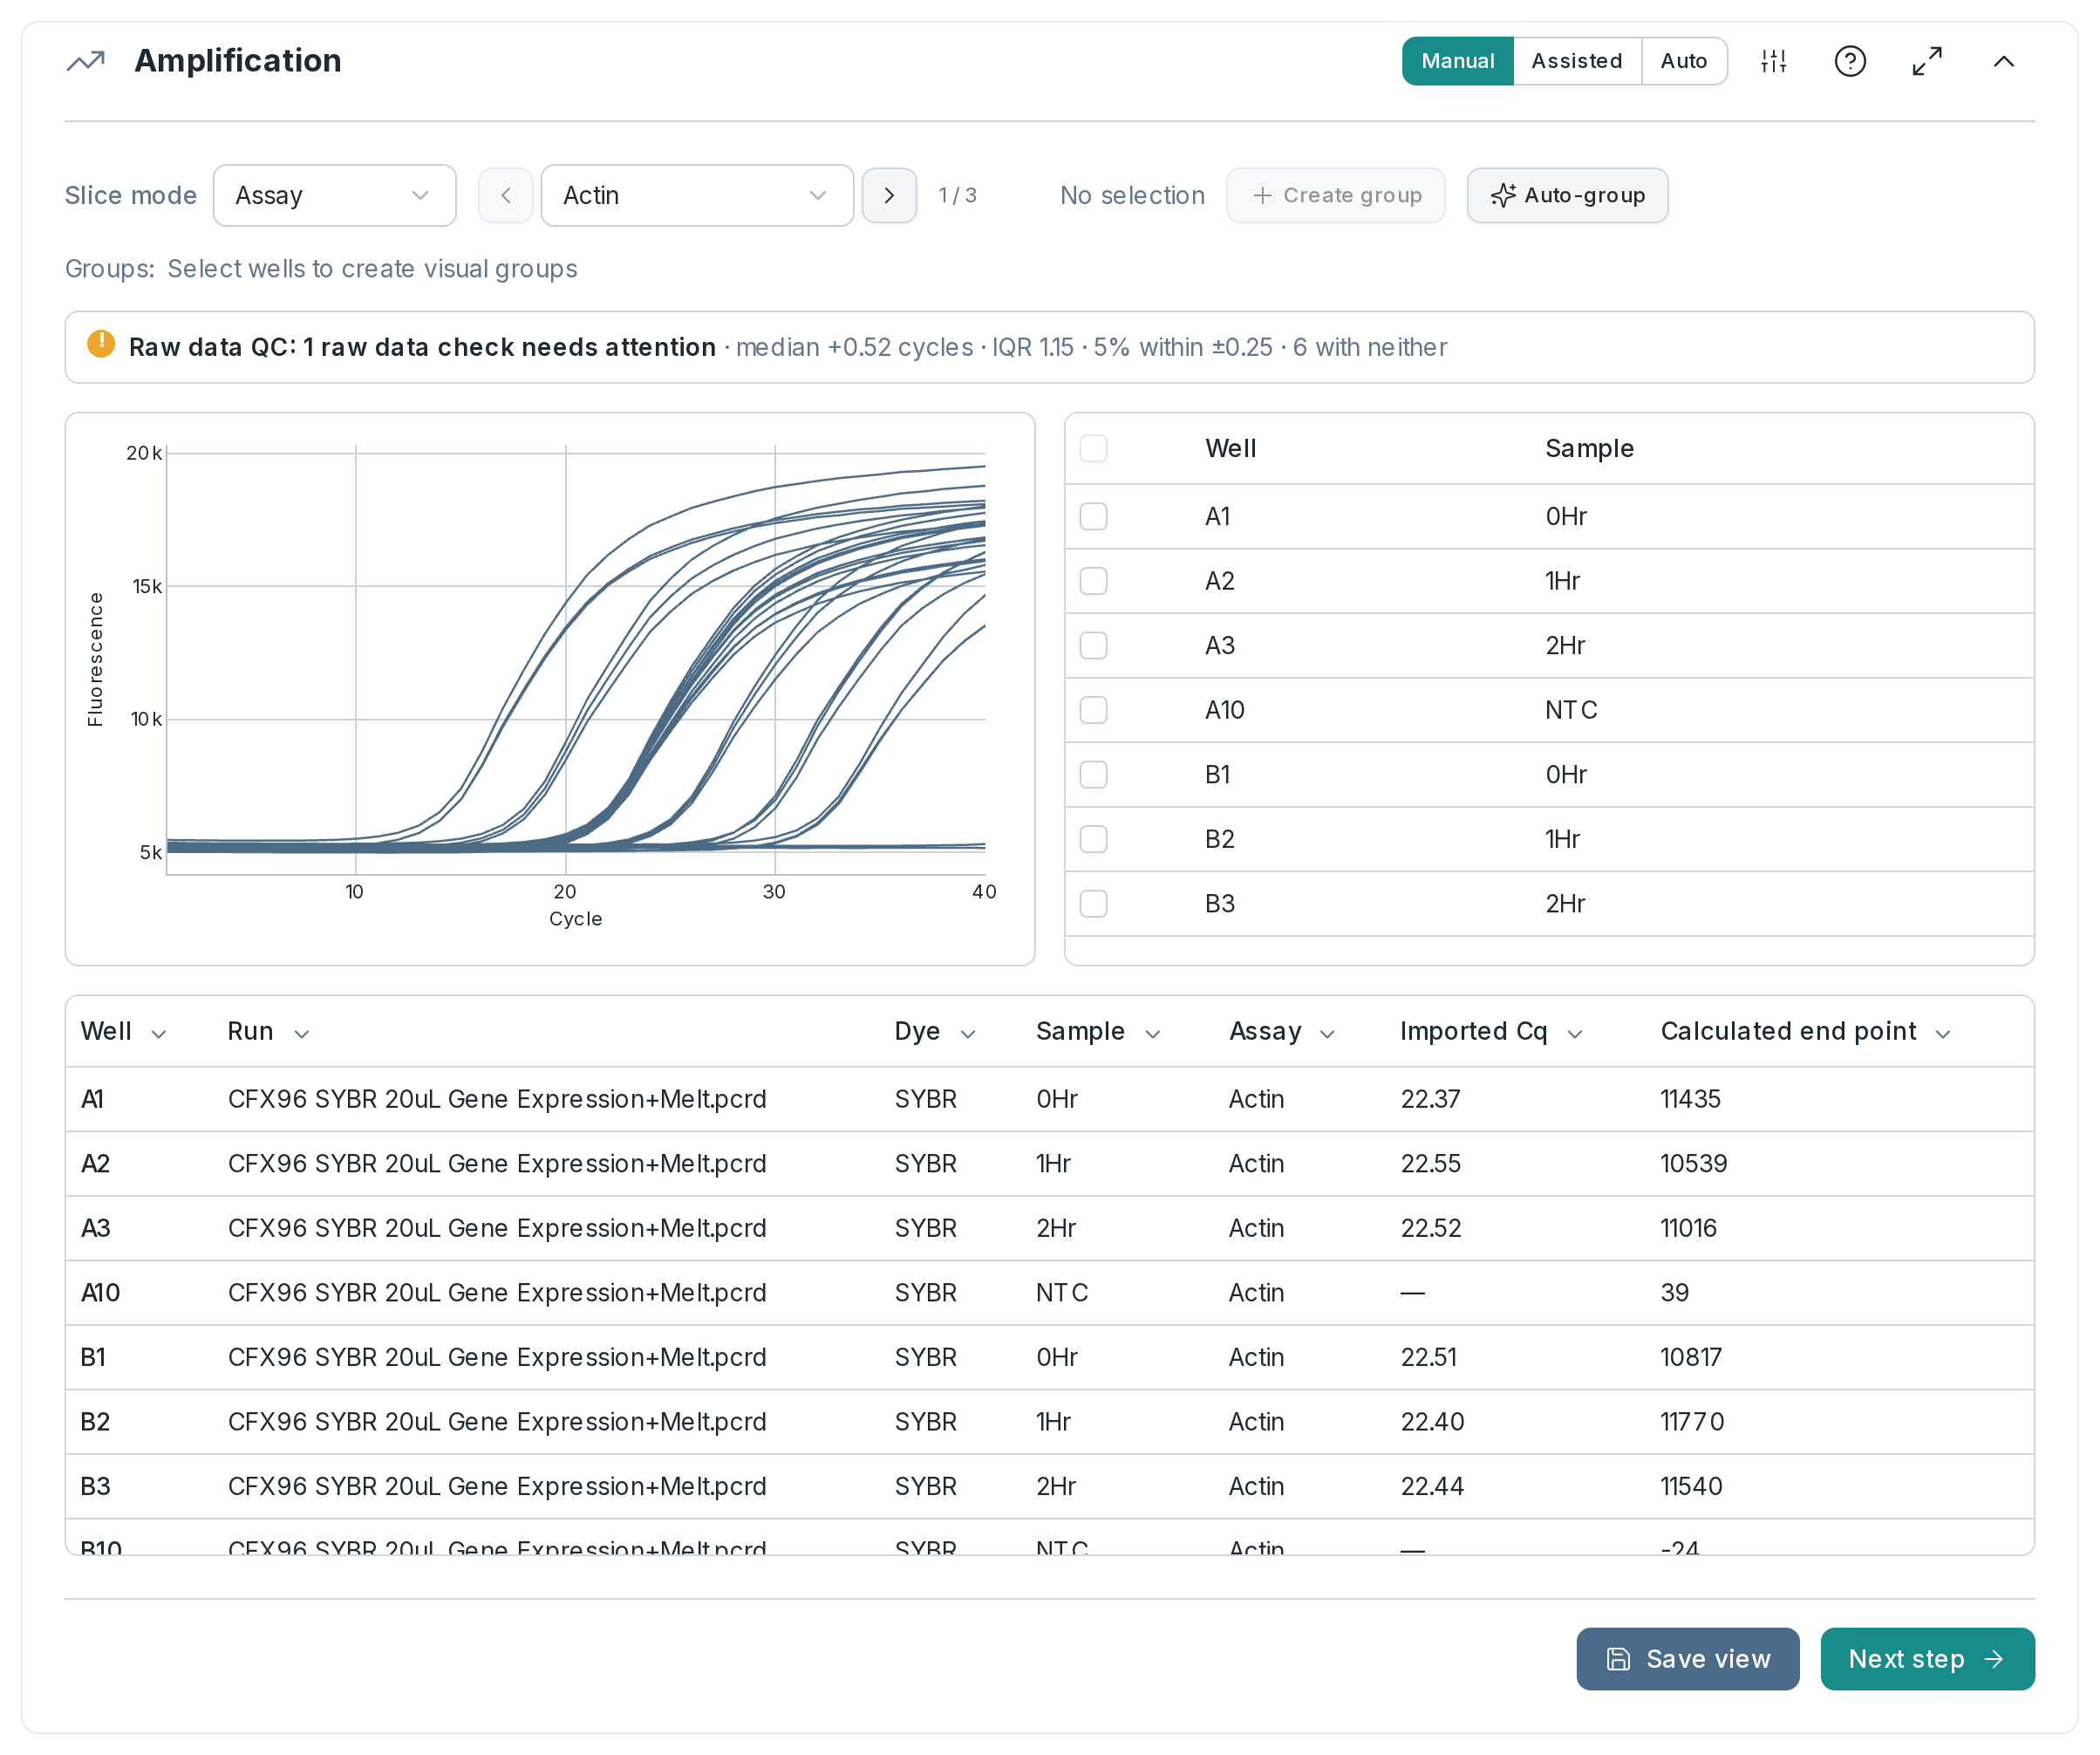
01In the app: Raw data
Cq from the curves, checked against the instrument
When the run file brings its curves, you see every well’s amplification and melt plot, and Clarida’s Cq beside the instrument’s, so a disagreement shows before it reaches a result. Raw data QC then checks each curve’s fit, its noise and its gap to the instrument’s Cq. A Cq table has no curves, so it starts at the next part.
- Cq method: a curve fit per well (Clarida’s default), a baseline and threshold, or the second-derivative maximum
- Cq source: automatic (the default), imported or calculated
- Baseline: automatic per curve (the default), or a cycle window you set
- Melt: Tm by Savitzky–Golay smoothing (Savitzky and Golay, 1964, default) or a cubic spline
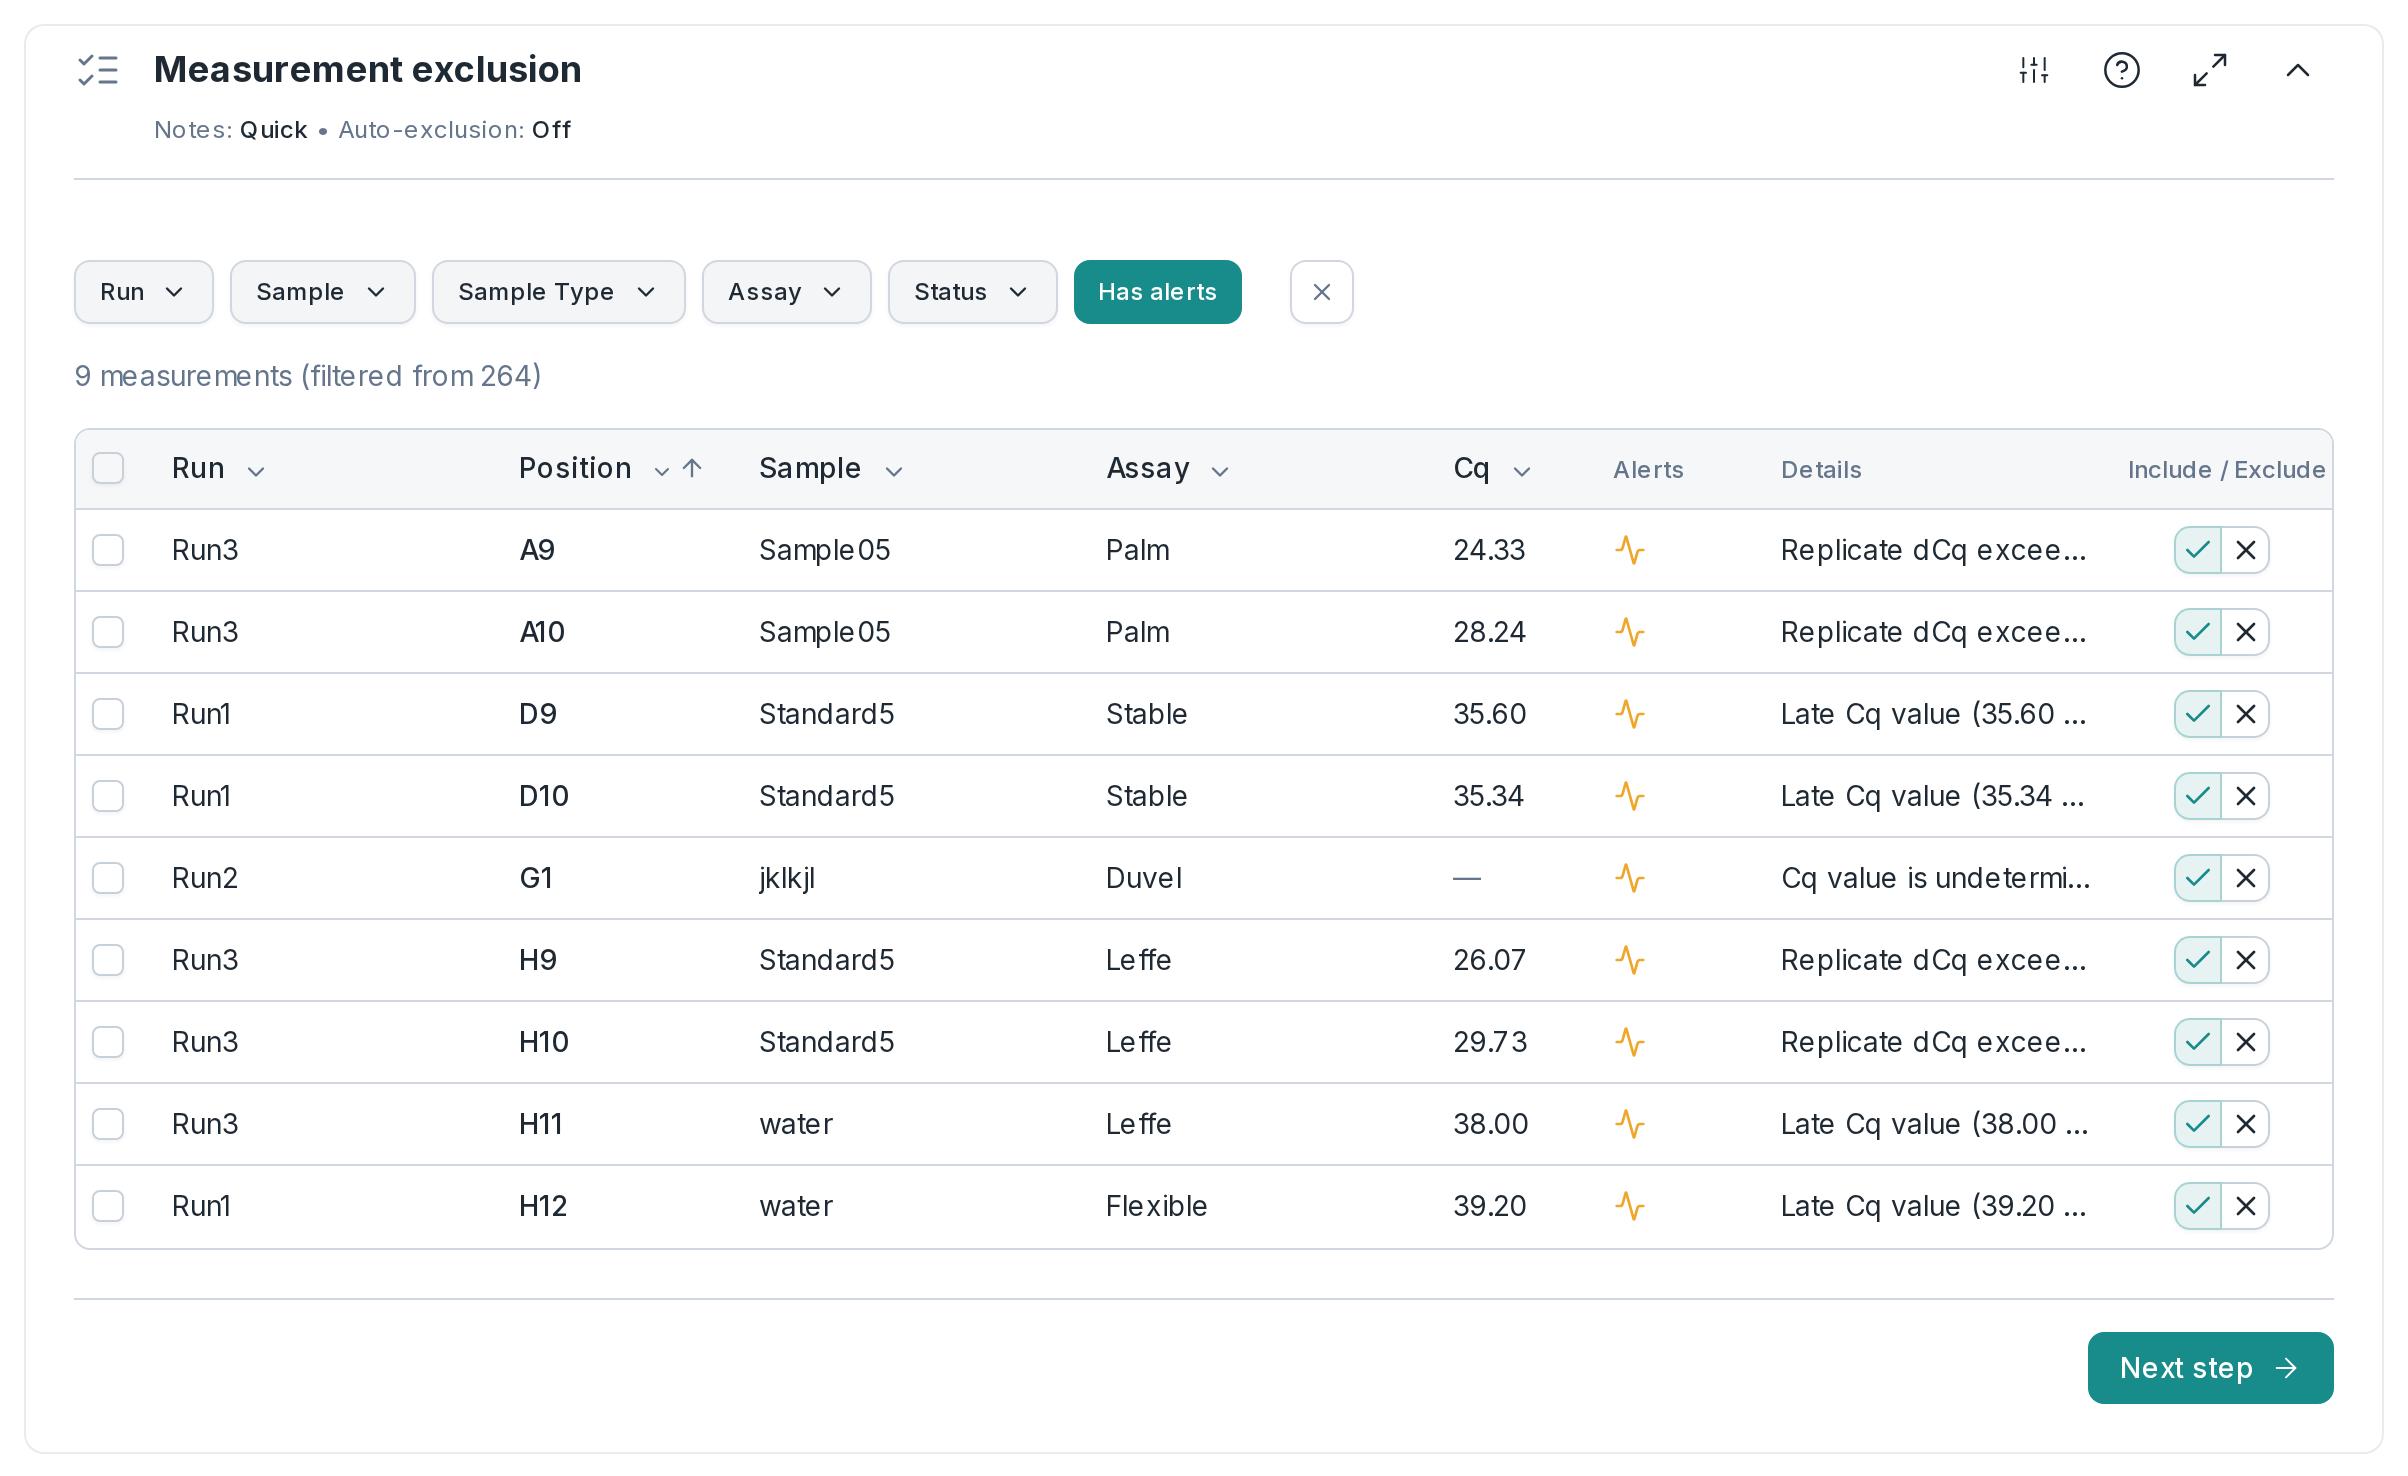
02In the app: Cq processing › Exclusion
Every exclusion with its reason
Each suspect measurement is listed with its reason: undetermined, later than your Cq limit, out of line with its replicates, or a bench note on the well (shown, never applied). Exclude by hand, or let a rule handle failing replicates; a rule never overwrites a decision you made.
- Notes: quick, or audit mode (a note with every exclusion)
- Automatic exclusion: off (the default), the whole replicate set, or the outlier only
- Judged by: ΔCq or SD
03In the app: Cq processing › IRC
Plates from different runs, made comparable
When a sample is measured for the same target on two or more runs, Clarida corrects the run-to-run shift before anything is compared across plates. You don’t mark calibrators: the part appears as soon as runs share a sample.
- Calibration: apply (the default), skip, or keep the calibrated Cq values that came with the file
04In the app: Cq processing › Replicates
Replicates that agree, or a flag
Each group of technical replicates gets its spread against a threshold you set. A group beyond it is flagged, so one discordant well cannot quietly move the mean.
- Combine replicates by: mean (the default) or median
- Spread: ΔCq (0.5 cycles by default) or SD (0.25)
05In the app: Cq processing › Efficiency
Each assay’s real efficiency
A wrong efficiency biases every quantity it touches, so it is set per assay. Fit a standard curve and you get the efficiency, slope, intercept and R² that MIQE asks you to report. An outlying dilution point is flagged; once you exclude it, it is left out of the analysis and the efficiency is recalculated.
- Mode: automatic, assisted or manual
- Assisted takes first: this experiment’s standard curve (the default), your library’s value, perfect doubling (E = 2) or one you enter
06In the app: Cq processing › Normalization
Normalized against reference genes you validated
Relative quantities are normalized with the geometric mean of your reference genes, or with the global mean for large panels, corrected for each assay’s efficiency, with the error carried through. Their stability (geNorm M, CV) is shown beside them; ranking candidates is a reference genes experiment. A sample missing one of its reference genes gets no normalized value rather than a misleading one.
- Mode: automatic (the default) or manual
- Method: reference genes, the global mean (also over common targets only), or none
- Scale to: the average (the default), the maximum, the minimum, a sample, a group, the positive controls or a calibrator
- Scaled over: unknowns only (the default), or all but the negative controls
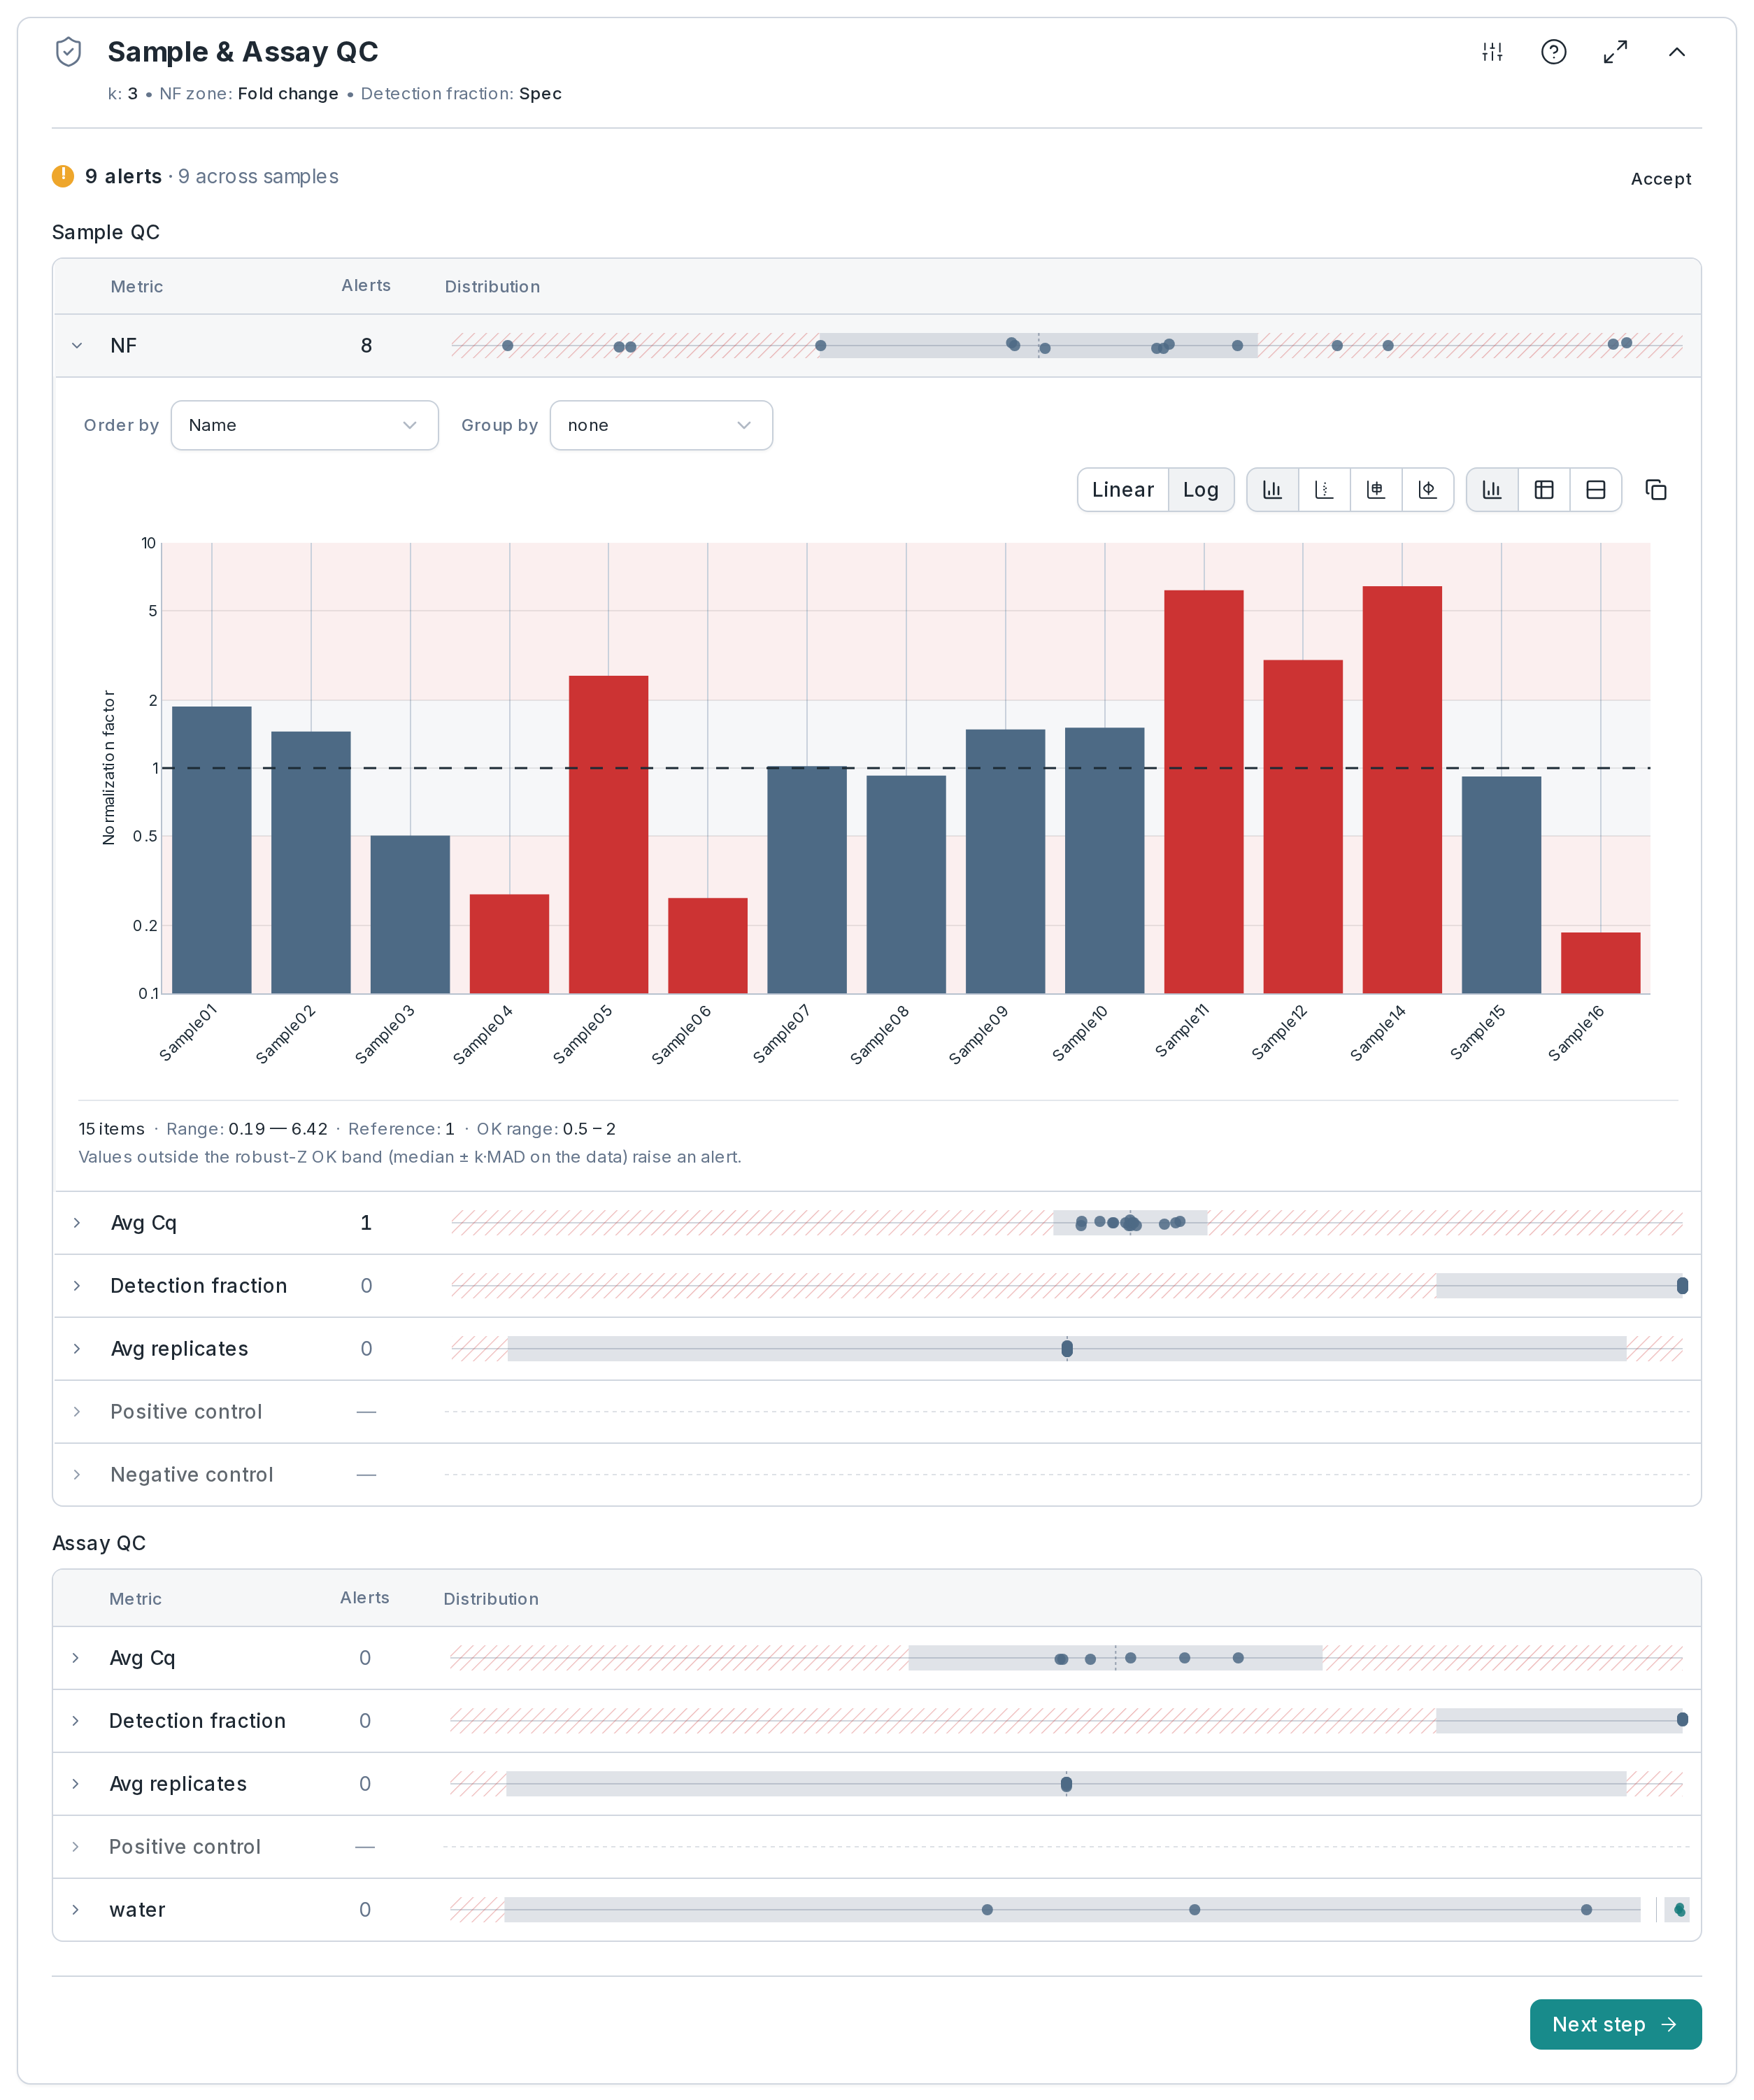
07In the app: Sample/Assay QC
A failing sample or assay, before it skews the result
Each quality metric is drawn as a distribution, every sample and assay a point: the normalization factor, the average Cq, the detection fraction and the replicate count. Each has its own test: a fixed window for the normalization factor (0.5 to 2), a floor for the detection fraction (0.8), the distribution for the other two. Nothing is removed here; you decide upstream, and the view updates.
- Per metric: a fold-change window, a distribution or a fixed limit
- Negative controls: automatic (any Cq counts as contamination), a Cq floor or a ΔCq margin
08In the app: Exploration
Follow a hunch, and keep it
Look at your relative quantities from several angles without testing anything yet. A view worth keeping is saved as a frozen record with your notes, and reopens exactly as you left it, even after you change a setting upstream.
- Views: a bar chart, one gene plotted on another, or a gene by a sample property such as dose
Read the method: Exploring qPCR data
09In the app: Statistics & apps
Tests set up once, saved as they ran
Each test is set up once and kept as it ran, so it cannot drift while you adjust groups. The t-tests and ANOVA run on log-transformed relative quantities and return the fold change with its confidence interval; Wilcoxon and Mann–Whitney a p-value. The same part holds four apps: the reference gene finder (geNorm or NormFinder), plate homogeneity, detection and genotyping, with its calls and report.
- Tests: Welch’s and Student’s t-test, the paired t-test, Wilcoxon signed-rank, Mann–Whitney U, one-way ANOVA, and Pearson and Spearman correlation
- After ANOVA: Tukey, Dunnett or Bonferroni
- Corrections: Benjamini–Hochberg, Holm, Bonferroni (not for correlations) or none
Which parts you see
Your lab can change these in its workflow layout; hiding a part changes what you see, never the result.
| Gene expression | Every part above |
|---|---|
| Reference genes (geNorm) | Raw data to efficiency, sample and assay QC, the bar chart, the reference gene finder |
| Genotyping | Raw data, exclusion (directly under Analyze), genotype calling, sample and assay QC, the genotyping report |
| Detection | Raw data, exclusion (directly under Analyze), sample and assay QC, detection |
| Plate homogeneity | Raw data, plate homogeneity |
What Analyze doesn’t do
| Absolute quantification and copy number | Not yet. Planned, from a standard curve; today one sets the efficiency |
|---|---|
| A MIQE check | It shows the efficiency, slope and R² MIQE asks for, but nothing checks the experiment against MIQE |
| AI | None: every calculation is a published method |
Frequently asked questions
Can you keep the Ct values your instrument calculated?
Yes. Set the Cq source to imported and Clarida uses the instrument’s values as they came, whether it calls them Ct, Cp or Cq. Raw data still shows Clarida’s own beside them.
Which housekeeping genes should you use?
The stable ones in your own samples: rank your candidates with geNorm or NormFinder in a reference genes experiment.